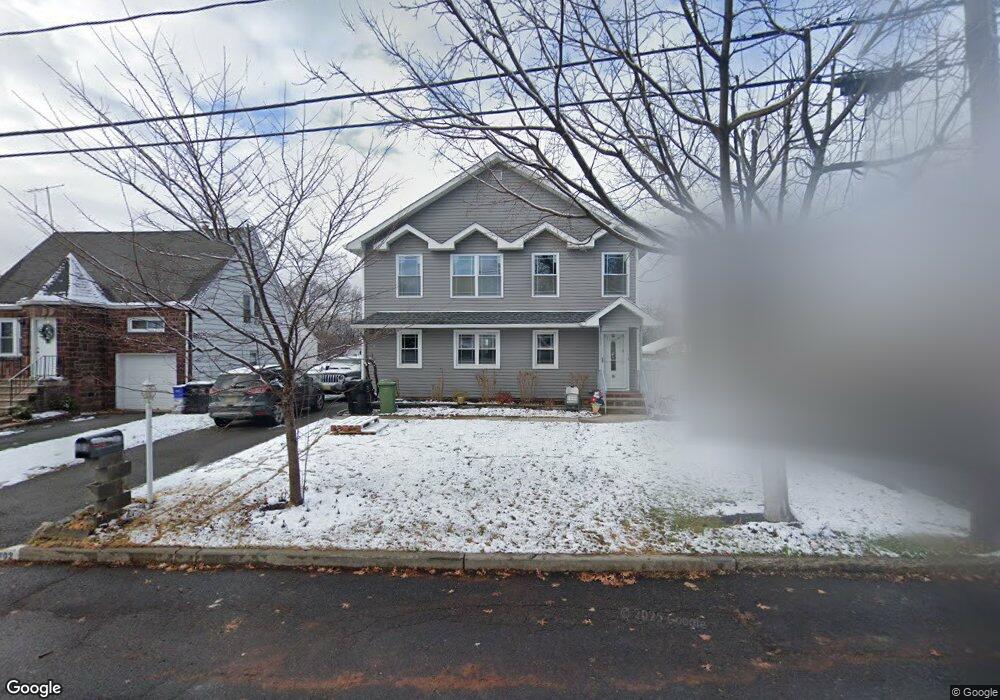
103 Westview Ave Paramus, NJ 07652
Estimated Value: $627,953 - $820,000
Studio
--
Bath
1,514
Sq Ft
$481/Sq Ft
Est. Value
About This Home
This home is located at 103 Westview Ave, Paramus, NJ 07652 and is currently estimated at $727,988, approximately $480 per square foot. 103 Westview Ave is a home located in Bergen County with nearby schools including Paramus High School and Yavneh Academy.
Ownership History
Date
Name
Owned For
Owner Type
Purchase Details
Closed on
Jun 20, 2021
Sold by
Kirpalani Sonu R and Partridge Nisha D
Bought by
Kirpalani Sonu R
Current Estimated Value
Purchase Details
Closed on
Jun 22, 2018
Sold by
Partridge Nisha D and Lalwani Raju S
Bought by
Kirpalani Sonu R and Partridge Nisha D
Purchase Details
Closed on
Apr 19, 2018
Sold by
Kirpalani Ramesh B and Kirpalani Sonu R
Bought by
Patridge Nisha D and Lalwani Raju S
Purchase Details
Closed on
Apr 16, 2013
Sold by
Kirpalani Ramesh B and Kirpalani Sonu R
Bought by
Kirpalani Ramesh B and Kirpalani Sonu R
Purchase Details
Closed on
Jul 30, 2002
Sold by
Silverman Eric
Bought by
Kirpalani Ramesh B and Kirpalani Sonu R
Home Financials for this Owner
Home Financials are based on the most recent Mortgage that was taken out on this home.
Original Mortgage
$170,000
Interest Rate
6.58%
Create a Home Valuation Report for This Property
The Home Valuation Report is an in-depth analysis detailing your home's value as well as a comparison with similar homes in the area
Home Values in the Area
Average Home Value in this Area
Purchase History
| Date | Buyer | Sale Price | Title Company |
|---|---|---|---|
| Kirpalani Sonu R | -- | None Available | |
| Kirpalani Sonu R | -- | -- | |
| Patridge Nisha D | -- | -- | |
| Kirpalani Ramesh B | $55,254 | -- | |
| Kirpalani Ramesh B | $230,000 | -- |
Source: Public Records
Mortgage History
| Date | Status | Borrower | Loan Amount |
|---|---|---|---|
| Previous Owner | Kirpalani Ramesh B | $170,000 |
Source: Public Records
Tax History
| Year | Tax Paid | Tax Assessment Tax Assessment Total Assessment is a certain percentage of the fair market value that is determined by local assessors to be the total taxable value of land and additions on the property. | Land | Improvement |
|---|---|---|---|---|
| 2025 | $8,383 | $589,900 | $271,200 | $318,700 |
| 2024 | $8,107 | $553,700 | $252,400 | $301,300 |
| 2023 | $7,673 | $528,500 | $239,400 | $289,100 |
| 2022 | $7,673 | $494,400 | $223,500 | $270,900 |
| 2021 | $7,326 | $442,900 | $197,600 | $245,300 |
| 2020 | $6,841 | $428,900 | $188,100 | $240,800 |
| 2019 | $4,935 | $265,900 | $170,500 | $95,400 |
| 2018 | $4,874 | $265,900 | $170,500 | $95,400 |
| 2017 | $4,789 | $265,900 | $170,500 | $95,400 |
| 2016 | $4,659 | $265,900 | $170,500 | $95,400 |
| 2015 | $4,611 | $265,400 | $170,500 | $94,900 |
| 2014 | $4,562 | $265,400 | $170,500 | $94,900 |
Source: Public Records
Map
Nearby Homes
- 30 Marion Ave
- 47 Peek St
- 16 Oldis St
- 11 Thiem Ave
- 100 Chestnut St
- 648 Spring Valley Rd
- 107 Chestnut St
- 89 Forest Place
- 842 Grant Ave
- 124 Hazley Ave
- 761 Palmer Ave
- 43 Hoffman Ave
- 22 Parker Ave
- 44 Forsythia Ln
- 104 Stone St
- 175 Rochelle Ave Unit 301
- 194 Saddle River Rd
- 21A Millar Ct
- 59 Washington Ave
- 46 Knollwood Dr
- 105 Westview Ave
- 101 Westview Ave
- 107 Westview Ave
- 108 Cloverdale Ave
- 95 Westview Ave
- 109 Westview Ave
- 110 Cloverdale Ave
- 111 Westview Ave
- 107 S Farview Ave Unit H
- 107 S Farview Ave
- 112 Cloverdale Ave
- 56 Cloverdale Ave
- 105 Cloverdale Ave
- 113 Westview Ave
- 112 Westview Ave
- 107 Cloverdale Ave
- 114 Cloverdale Ave
- 114 Cloverdale Ave Unit 1
- 114 Cloverdale Ave Unit 2
- 109 Cloverdale Ave
Your Personal Tour Guide
Ask me questions while you tour the home.