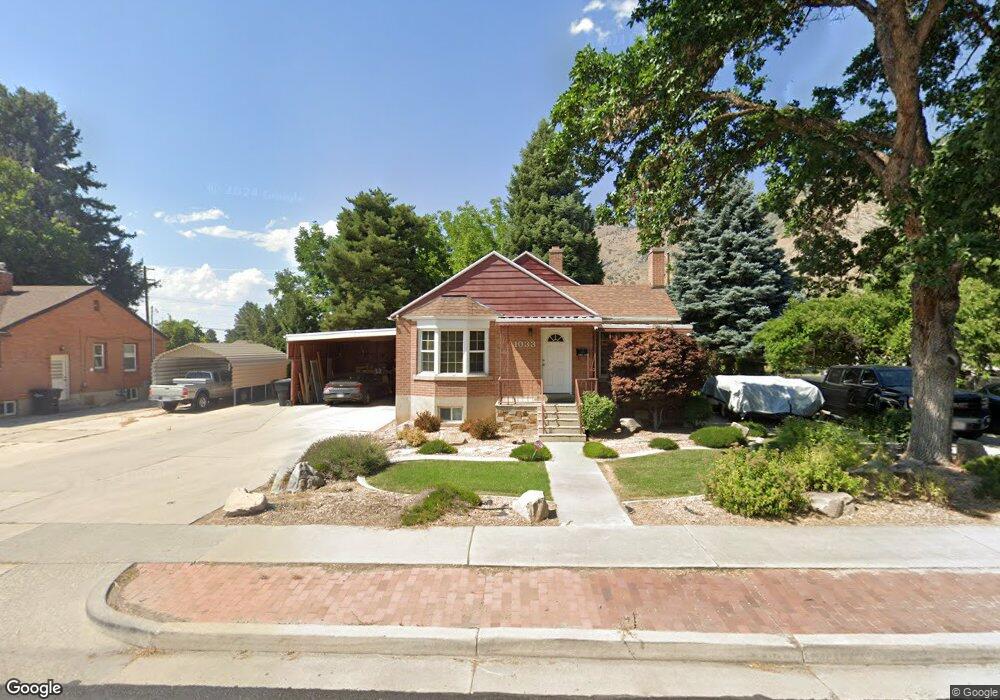
1033 E 400 S Springville, UT 84663
Estimated Value: $432,000 - $499,000
2
Beds
2
Baths
1,116
Sq Ft
$415/Sq Ft
Est. Value
About This Home
This home is located at 1033 E 400 S, Springville, UT 84663 and is currently estimated at $462,823, approximately $414 per square foot. 1033 E 400 S is a home located in Utah County with nearby schools including Brookside School, Springville Junior High School, and Springville High School.
Ownership History
Date
Name
Owned For
Owner Type
Purchase Details
Closed on
Aug 9, 1999
Sold by
Dunn Alan Verl
Bought by
Escco Ltd
Current Estimated Value
Purchase Details
Closed on
Aug 4, 1999
Sold by
Knotts Deeanna
Bought by
Escco Ltd
Purchase Details
Closed on
Jul 30, 1999
Sold by
Dunn William Bryan
Bought by
Escco Ltd
Purchase Details
Closed on
Jul 1, 1999
Sold by
Knotts Deeanna
Bought by
Essco Ltd
Create a Home Valuation Report for This Property
The Home Valuation Report is an in-depth analysis detailing your home's value as well as a comparison with similar homes in the area
Home Values in the Area
Average Home Value in this Area
Purchase History
| Date | Buyer | Sale Price | Title Company |
|---|---|---|---|
| Escco Ltd | -- | Pro Title & Escrow Inc | |
| Escco Ltd | -- | Pro Title & Escrow Inc | |
| Escco Ltd | -- | Pro Title & Escrow Inc | |
| Essco Ltd | -- | Pro Title & Escrow Inc |
Source: Public Records
Tax History
| Year | Tax Paid | Tax Assessment Tax Assessment Total Assessment is a certain percentage of the fair market value that is determined by local assessors to be the total taxable value of land and additions on the property. | Land | Improvement |
|---|---|---|---|---|
| 2025 | $3,857 | $427,700 | $159,600 | $268,100 |
| 2024 | $3,857 | $395,100 | $0 | $0 |
| 2023 | $3,752 | $384,800 | $0 | $0 |
| 2022 | $3,835 | $386,200 | $155,100 | $231,100 |
| 2021 | $1,867 | $292,700 | $114,900 | $177,800 |
| 2020 | $1,673 | $254,300 | $85,100 | $169,200 |
| 2019 | $1,552 | $240,100 | $70,900 | $169,200 |
| 2018 | $1,444 | $213,100 | $66,000 | $147,100 |
| 2017 | $1,310 | $102,740 | $0 | $0 |
| 2016 | $1,117 | $85,855 | $0 | $0 |
| 2015 | $989 | $77,715 | $0 | $0 |
| 2014 | $918 | $71,665 | $0 | $0 |
Source: Public Records
Map
Nearby Homes
- 802 S Brookside Dr
- 1130 Hillcrest Dr
- 1185 Hillcrest Dr
- 805 E 400 S
- 125 S Canyon Ave
- 1361 E 400 S
- 883 E 700 S
- 645 Swenson Ave Unit 5
- 645 Swenson Ave Unit 3
- 647 Swenson Ave Unit 3
- 557 S 1470 E
- 899 E 800 S
- 616 E Aaron Ave
- 445 E 535 S
- 949 S 1060 E
- 677 E 800 South St
- 926 E 250 N
- 585 S 400 E
- 601 S 400 E
- 579 E 800 St S
Your Personal Tour Guide
Ask me questions while you tour the home.