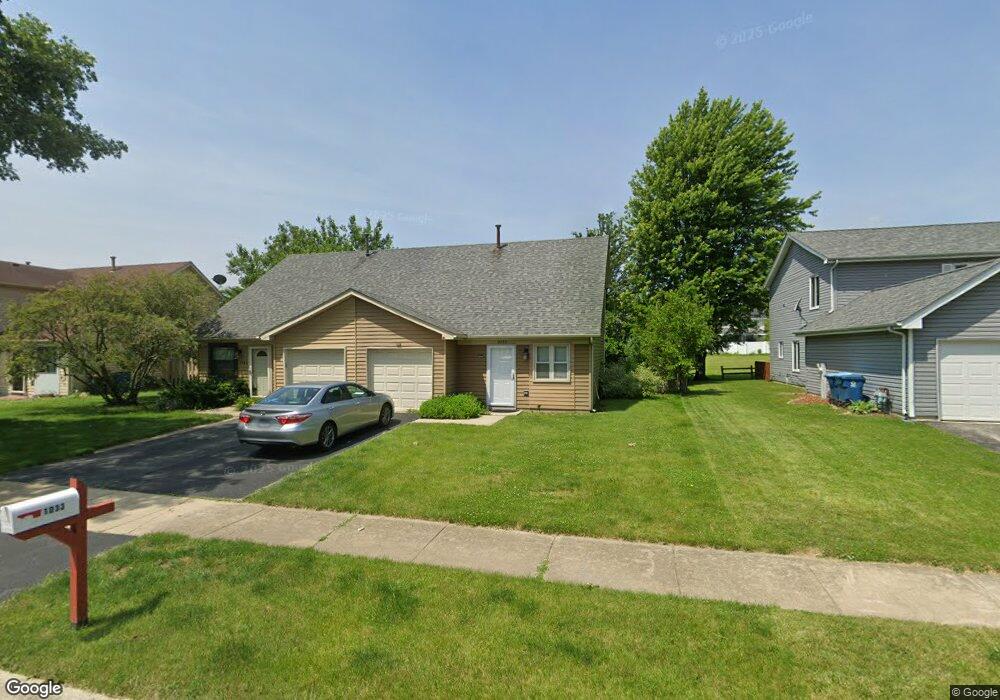
1033 Pheasant Run Ln Aurora, IL 60504
South East Village NeighborhoodEstimated Value: $220,000 - $259,819
2
Beds
1
Bath
864
Sq Ft
$273/Sq Ft
Est. Value
About This Home
This home is located at 1033 Pheasant Run Ln, Aurora, IL 60504 and is currently estimated at $235,705, approximately $272 per square foot. 1033 Pheasant Run Ln is a home located in DuPage County with nearby schools including Georgetown Elementary School, Fischer Middle School, and Waubonsie Valley High School.
Ownership History
Date
Name
Owned For
Owner Type
Purchase Details
Closed on
Jan 28, 2005
Sold by
Carranza Rosemary
Bought by
Ghaziuddin Mohammad and Ghaziuddin Neera
Current Estimated Value
Home Financials for this Owner
Home Financials are based on the most recent Mortgage that was taken out on this home.
Original Mortgage
$109,600
Outstanding Balance
$55,891
Interest Rate
5.8%
Mortgage Type
Purchase Money Mortgage
Estimated Equity
$179,814
Purchase Details
Closed on
Sep 24, 2003
Sold by
Ondrus Steve G and Ondrus Constance L
Bought by
Carranza Rosemary
Home Financials for this Owner
Home Financials are based on the most recent Mortgage that was taken out on this home.
Original Mortgage
$132,800
Interest Rate
6.49%
Mortgage Type
FHA
Purchase Details
Closed on
May 26, 2000
Sold by
Tolemy Robert B
Bought by
Ondrus Steven G and Ondrus Constance L
Home Financials for this Owner
Home Financials are based on the most recent Mortgage that was taken out on this home.
Original Mortgage
$101,562
Interest Rate
8.56%
Mortgage Type
FHA
Purchase Details
Closed on
May 2, 1995
Sold by
Tolemy Kimberly M
Bought by
Tolemy Robert B
Create a Home Valuation Report for This Property
The Home Valuation Report is an in-depth analysis detailing your home's value as well as a comparison with similar homes in the area
Home Values in the Area
Average Home Value in this Area
Purchase History
| Date | Buyer | Sale Price | Title Company |
|---|---|---|---|
| Ghaziuddin Mohammad | $137,000 | -- | |
| Carranza Rosemary | $135,000 | Pntn | |
| Ondrus Steven G | $102,500 | -- | |
| Tolemy Robert B | -- | -- |
Source: Public Records
Mortgage History
| Date | Status | Borrower | Loan Amount |
|---|---|---|---|
| Open | Ghaziuddin Mohammad | $109,600 | |
| Previous Owner | Carranza Rosemary | $132,800 | |
| Previous Owner | Ondrus Steven G | $101,562 |
Source: Public Records
Tax History
| Year | Tax Paid | Tax Assessment Tax Assessment Total Assessment is a certain percentage of the fair market value that is determined by local assessors to be the total taxable value of land and additions on the property. | Land | Improvement |
|---|---|---|---|---|
| 2024 | $4,700 | $61,810 | $22,447 | $39,363 |
| 2023 | $4,514 | $55,540 | $20,170 | $35,370 |
| 2022 | $4,143 | $49,410 | $17,820 | $31,590 |
| 2021 | $4,041 | $47,640 | $17,180 | $30,460 |
| 2020 | $4,091 | $47,640 | $17,180 | $30,460 |
| 2019 | $3,958 | $45,310 | $16,340 | $28,970 |
| 2018 | $2,687 | $30,420 | $10,900 | $19,520 |
| 2017 | $2,487 | $27,600 | $9,890 | $17,710 |
| 2016 | $1,756 | $24,990 | $8,950 | $16,040 |
| 2015 | $1,715 | $23,730 | $8,500 | $15,230 |
| 2014 | $1,645 | $22,510 | $8,000 | $14,510 |
| 2013 | $1,632 | $22,670 | $8,060 | $14,610 |
Source: Public Records
Map
Nearby Homes
- 1185 Norwood Ln
- 3479 Charlemaine Dr
- 3431 Charlemaine Dr
- 1371 E Braymore Cir
- 3389 Ravinia Cir
- 3467 Ravinia Cir
- 890 Fieldside Ln Unit 13A
- 1544 Normantown Rd Unit 395
- 2942 Shelly Ln Unit 25
- 3730 Baybrook Dr Unit 26
- 1335 Lawrence Ct
- 2891 Bar Harbour Rd
- 3723 Edgebrook Ct
- 3140 Medford Ct
- 2860 Bridgeport Ln Unit 19D
- 1465 Bridgeport Ln Unit 19D
- 2750 Shelly Ln
- 525 Chester Ct W
- 515 Cimarron Dr W Unit 20A
- 3819 Cadella Cir
- 1035 Pheasant Run Ln Unit 18C
- 1039 Pheasant Run Ln
- 1029 Pheasant Run Ln
- 1041 Pheasant Run Ln
- 1027 Pheasant Run Ln Unit 18C
- 1023 Pheasant Run Ln Unit 18C
- 1030 Pheasant Run Ln Unit 16C
- 1030 Pheasant Run Ln Unit 1030
- 1032 Pheasant Run Ln Unit 18C
- 1026 Pheasant Run Ln Unit 18C
- 1021 Pheasant Run Ln
- 1024 Pheasant Run Ln Unit 18C
- 1045 Pheasant Run Ln Unit 18C
- 1020 Pheasant Run Ln
- 1017 Pheasant Run Ln Unit 18C
- 1047 Pheasant Run Ln Unit 18C
- 1060 Camden Ln Unit 17B
- 1015 Pheasant Run Ln
- 1060 Pheasant Run Ln Unit 18C
- 1051 Pheasant Run Ln Unit 18C
Your Personal Tour Guide
Ask me questions while you tour the home.