10357 738 Rd Bertrand, NE 68927
Estimated Value: $309,000 - $357,000
Studio
--
Bath
1,280
Sq Ft
$266/Sq Ft
Est. Value
About This Home
This home is located at 10357 738 Rd, Bertrand, NE 68927 and is currently estimated at $339,938, approximately $265 per square foot. 10357 738 Rd is a home located in Phelps County with nearby schools including Bertrand Elementary School and Bertrand High School.
Ownership History
Date
Name
Owned For
Owner Type
Purchase Details
Closed on
Dec 28, 2023
Sold by
Langenberg Larry E and Langenberg Joyce L
Bought by
Langenberg Matthew
Current Estimated Value
Home Financials for this Owner
Home Financials are based on the most recent Mortgage that was taken out on this home.
Original Mortgage
$240,000
Outstanding Balance
$235,558
Interest Rate
7.44%
Mortgage Type
New Conventional
Estimated Equity
$104,380
Purchase Details
Closed on
Oct 1, 2022
Sold by
Langenberg Michael L
Bought by
Langenberg Larry E and Langenberg Joyce L
Purchase Details
Closed on
Feb 21, 2017
Sold by
Langenberg Larry E and Langenberg Joyce L
Bought by
Langenberg Matthew M
Create a Home Valuation Report for This Property
The Home Valuation Report is an in-depth analysis detailing your home's value as well as a comparison with similar homes in the area
Purchase History
| Date | Buyer | Sale Price | Title Company |
|---|---|---|---|
| Langenberg Matthew | $300,000 | Phelps County Title | |
| Langenberg Larry E | -- | -- | |
| Langenberg Matthew M | -- | None Available |
Source: Public Records
Mortgage History
| Date | Status | Borrower | Loan Amount |
|---|---|---|---|
| Open | Langenberg Matthew | $240,000 |
Source: Public Records
Tax History
| Year | Tax Paid | Tax Assessment Tax Assessment Total Assessment is a certain percentage of the fair market value that is determined by local assessors to be the total taxable value of land and additions on the property. | Land | Improvement |
|---|---|---|---|---|
| 2025 | $2,158 | $333,039 | $52,989 | $280,050 |
| 2024 | $588 | $270,566 | $52,351 | $218,215 |
| 2023 | $588 | $251,694 | $52,139 | $199,555 |
| 2022 | $632 | $243,104 | $51,714 | $191,390 |
| 2021 | $0 | $229,466 | $51,926 | $177,540 |
| 2020 | $0 | $229,679 | $52,139 | $177,540 |
| 2019 | $458 | $217,702 | $52,777 | $164,925 |
| 2018 | $458 | $208,257 | $47,777 | $160,480 |
| 2017 | $494 | $201,292 | $40,352 | $160,940 |
| 2016 | $387 | $211,164 | $36,984 | $174,180 |
| 2015 | $400 | $211,164 | $36,984 | $174,180 |
| 2014 | $2,842 | $175,829 | $35,839 | $139,990 |
| 2013 | $2,842 | $175,829 | $35,839 | $139,990 |
Source: Public Records
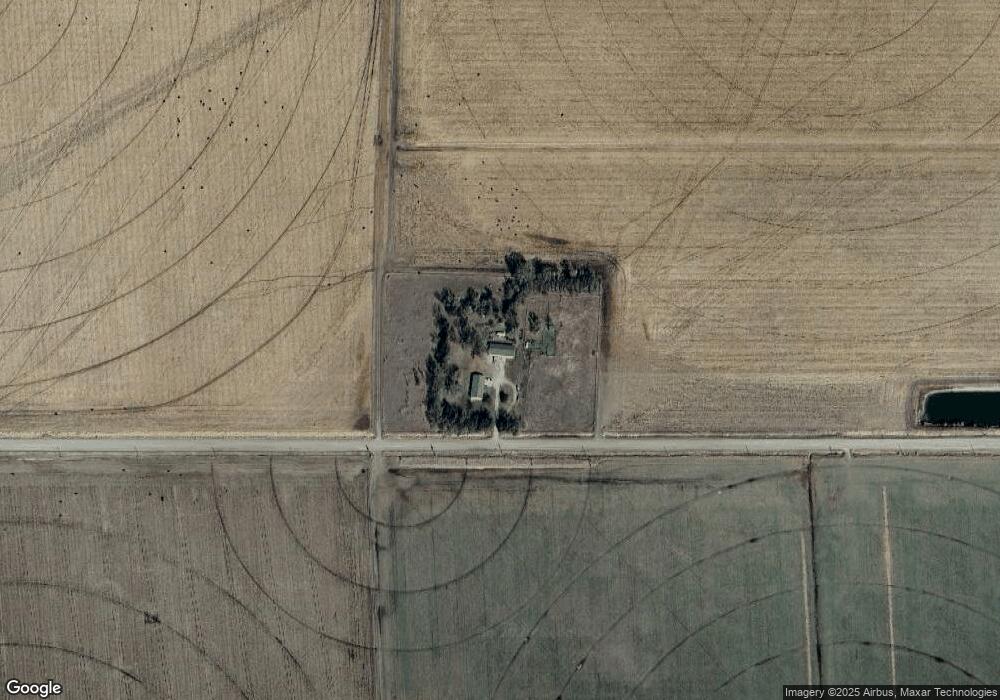
Map
Nearby Homes
- 303 Bryan St
- Lexington Unit NE 68850
- Lexington Unit NE 68850
- Lexington Unit NE 68850
- 1306 Maberly St
- 901 Maberly St
- 815 Tibbals St
- 1023 Hancock St
- 73803 Highway 183
- 1019 Hancock St
- 420 14th Ave
- 602 11th Ave
- 1103 East Ave
- 1010 East Ave
- 816 Garfield St
- 915 Sherman St
- 1313 Pamela Ave
- 301 S C St
- 601 A St
- TRACT I Huber Addition
Your Personal Tour Guide
Ask me questions while you tour the home.