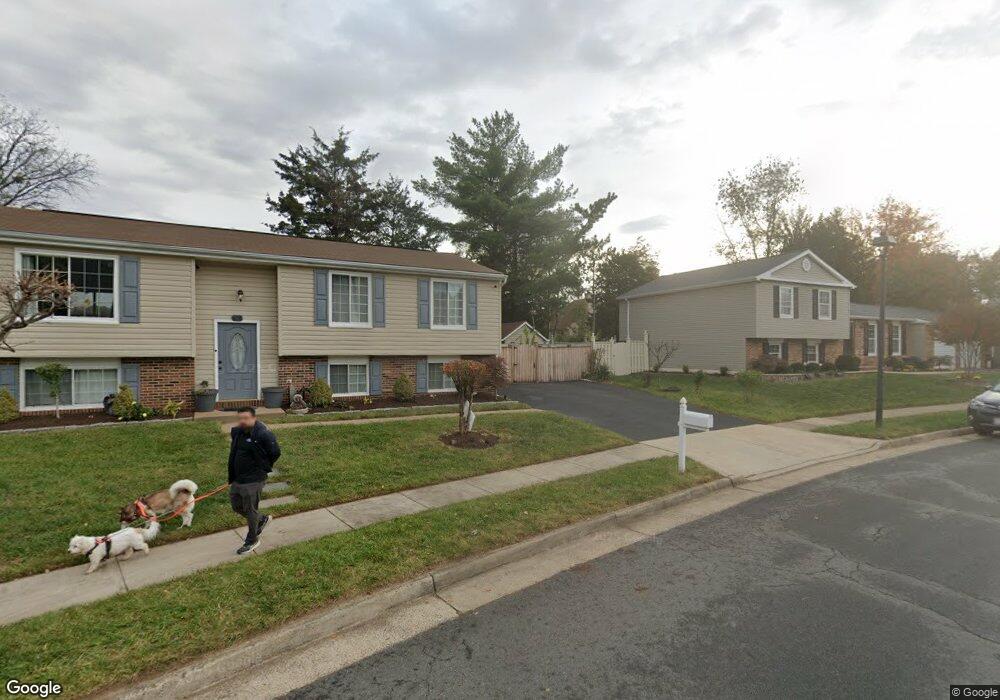
1036 Elder Ct Herndon, VA 20170
Estimated Value: $572,000 - $598,000
About This Home
This home is located at 1036 Elder Ct, Herndon, VA 20170 and is currently estimated at $584,322, approximately $363 per square foot. 1036 Elder Ct is a home located in Fairfax County with nearby schools including Dranesville Elementary, Herndon Middle School, and Herndon High School.
Ownership History
We collect this data history from publicly available records. To have your information removed, we recommend requesting removal directly through your county’s website.
Purchase Details
Home Financials for this Owner
Home Financials are based on the most recent Mortgage that was taken out on this home.Home Values in the Area
Average Home Value in this Area
Purchase History
We collect this data history from publicly available records. To have your information removed, we recommend requesting removal directly through your county’s website.
| Date | Buyer | Sale Price | Title Company |
|---|---|---|---|
| $165,000 | -- |
Mortgage History
We collect this data history from publicly available records. To have your information removed, we recommend requesting removal directly through your county’s website.
| Date | Status | Borrower | Loan Amount |
|---|---|---|---|
| Open | $151,989 |
Tax History
We collect this data history from publicly available records. To have your information removed, we recommend requesting removal directly through your county’s website.
| Year | Tax Paid | Tax Assessment Tax Assessment Total Assessment is a certain percentage of the fair market value that is determined by local assessors to be the total taxable value of land and additions on the property. | Land | Improvement |
|---|---|---|---|---|
| 2025 | $7,325 | $522,730 | $150,000 | $372,730 |
| 2024 | $7,325 | $516,390 | $150,000 | $366,390 |
| 2023 | $7,004 | $504,440 | $150,000 | $354,440 |
| 2022 | $6,289 | $446,510 | $140,000 | $306,510 |
| 2021 | $4,999 | $425,980 | $125,000 | $300,980 |
| 2020 | $4,751 | $401,470 | $120,000 | $281,470 |
| 2019 | $4,632 | $391,360 | $115,000 | $276,360 |
| 2018 | $4,109 | $357,300 | $112,000 | $245,300 |
| 2017 | $4,148 | $357,300 | $112,000 | $245,300 |
| 2016 | $4,174 | $360,250 | $112,000 | $248,250 |
| 2015 | $3,786 | $339,240 | $110,000 | $229,240 |
| 2014 | $3,567 | $320,370 | $110,000 | $210,370 |
Map
- 1025 Boros Ct
- 1103 Burwick Dr
- 1103 Lopez Ln
- 1106 Whitworth Ct
- 915 Barton Oaks Place
- 106 Meeting House Station Square
- 815 Branch Dr Unit 401
- 815 Branch Dr Unit 402
- 12715 Taustin Ln
- 1300 Bayshire Ln
- 805 Monroe St
- 767 Monroe St
- 1100 Jeff Ryan Dr
- 12728 Builders Rd
- 904 Locust St
- 113 Dyer Ct
- 754 Barbaralynn Place
- 1630 Sadlers Wells Dr
- 1420 Cuttermill Ct
- 826 Van Buren St
Ask me questions while you tour the home.