10360 & 10370 Pendleton Ave Englewood, FL 34224
Englewood East NeighborhoodEstimated Value: $107,000
Studio
--
Bath
--
Sq Ft
24,394
Sq Ft Lot
About This Home
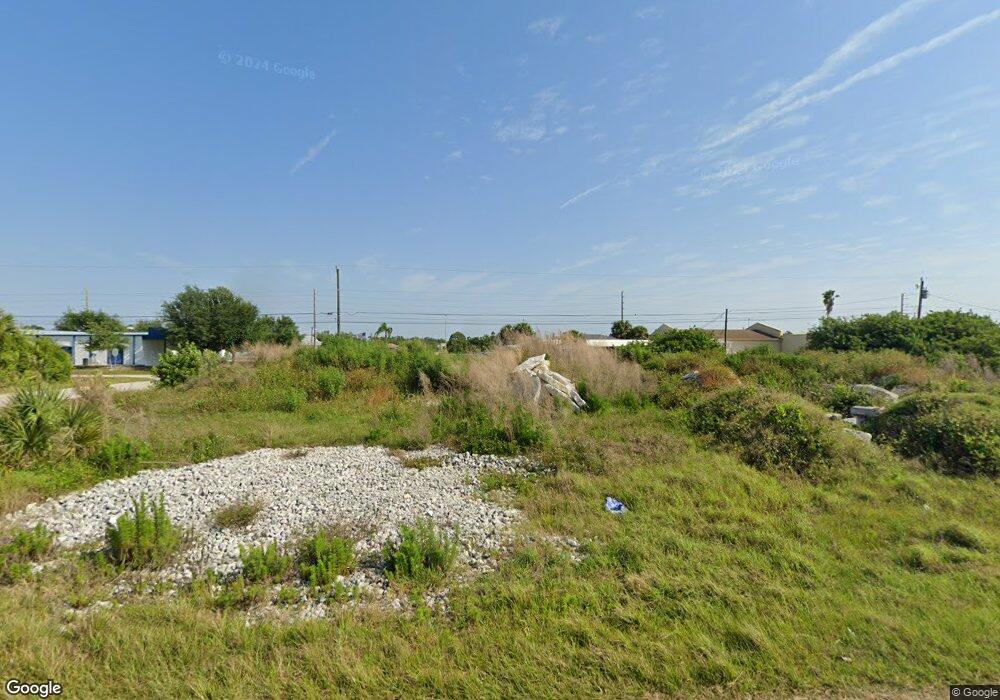
This home is located at 10360 & 10370 Pendleton Ave, Englewood, FL 34224 and is currently estimated at $107,000. 10360 & 10370 Pendleton Ave is a home located in Charlotte County with nearby schools including Myakka River Elementary School, L.A. Ainger Middle School, and Lemon Bay High School.
Ownership History
Date
Name
Owned For
Owner Type
Purchase Details
Closed on
Apr 26, 2022
Sold by
Southern Impression Homes Llc
Bought by
Dlp Land Holdings I Llc
Current Estimated Value
Home Financials for this Owner
Home Financials are based on the most recent Mortgage that was taken out on this home.
Original Mortgage
$4,058,205
Interest Rate
4.16%
Mortgage Type
Construction
Purchase Details
Closed on
Aug 26, 2020
Sold by
Taylor George Judson and Taylor Linda Joan
Bought by
Southern Impression Homes Llc
Purchase Details
Closed on
Oct 3, 2019
Sold by
Grand 9 Tax Liens Llc
Bought by
Taylor George Judson and Taylor Linda Joan
Purchase Details
Closed on
Jun 1, 2010
Sold by
Costello Linda
Bought by
Grand 9 Tax Liens Llc
Purchase Details
Closed on
Oct 2, 2000
Sold by
Wagner Penne L and Wagner Penee L
Bought by
Lee Michael L and Lee Faye E
Create a Home Valuation Report for This Property
The Home Valuation Report is an in-depth analysis detailing your home's value as well as a comparison with similar homes in the area
Home Values in the Area
Average Home Value in this Area
Purchase History
| Date | Buyer | Sale Price | Title Company |
|---|---|---|---|
| Dlp Land Holdings I Llc | $4,356,100 | New Title Company Name | |
| Southern Impression Homes Llc | $12,000 | Anchor Title Services Llc | |
| Taylor George Judson | -- | None Available | |
| Grand 9 Tax Liens Llc | $8,056 | Attorney | |
| Lee Michael L | $5,000 | -- |
Source: Public Records
Mortgage History
| Date | Status | Borrower | Loan Amount |
|---|---|---|---|
| Closed | Dlp Land Holdings I Llc | $4,058,205 |
Source: Public Records
Tax History
| Year | Tax Paid | Tax Assessment Tax Assessment Total Assessment is a certain percentage of the fair market value that is determined by local assessors to be the total taxable value of land and additions on the property. | Land | Improvement |
|---|---|---|---|---|
| 2025 | $1,055 | $33,660 | $33,660 | -- |
| 2024 | $975 | $38,760 | $38,760 | -- |
| 2023 | $975 | $32,300 | $32,300 | $0 |
| 2022 | $652 | $16,830 | $16,830 | $0 |
| 2021 | $599 | $9,180 | $9,180 | $0 |
| 2020 | $406 | $6,120 | $6,120 | $0 |
| 2019 | $398 | $5,440 | $5,440 | $0 |
| 2018 | $281 | $4,080 | $4,080 | $0 |
| 2017 | $266 | $3,570 | $3,570 | $0 |
| 2016 | $265 | $2,545 | $0 | $0 |
| 2015 | $256 | $2,314 | $0 | $0 |
| 2014 | $255 | $2,104 | $0 | $0 |
Source: Public Records
Map
Nearby Homes
- 6977 Hawksbury St
- 6985 Hawksbury St
- 10419 Pendleton Ave
- 7025 Lauretta St
- 4080 N Access Rd
- 4254 , 4260 & 4266 N Access Rd
- 3782 N Access Rd
- 3278-3294 N Access Rd
- 4254, 4260 & 4266 N Access Rd
- 6417 Flintlock St
- 4451 S Access Rd
- 4459 S Access Rd
- 4303 & 4307 S Access Rd
- 4491 S Access Rd
- 4515 S Access Rd
- 4435 S Access Rd
- 6950 Rosemont Dr Unit A & B
- 10253 Winstead Ave
- 10421 Reims Ave
- 7122 Rosemont Dr
- 10360 Pendleton Ave
- 10370 Pendleton Ave
- 10361 Pendleton Ave
- 10365 Pendleton Ave
- 3969 S Access Rd
- 10378 Pendleton Ave Unit A & B
- 10378 Pendleton Ave
- 10371 Pendleton Ave
- 3973 S Access Rd
- 3949 S Access Rd
- 10336 Pendleton Ave
- 10334 Pendleton Ave
- 3985 S Access Rd
- 6992 Fir St
- 7024 Fir St
- 10388 Pendleton Ave
- 10387 Pendleton Ave
- 6993 Hawksbury St
- 10395 Pendleton Ave
- 3993 S Access Rd
Your Personal Tour Guide
Ask me questions while you tour the home.