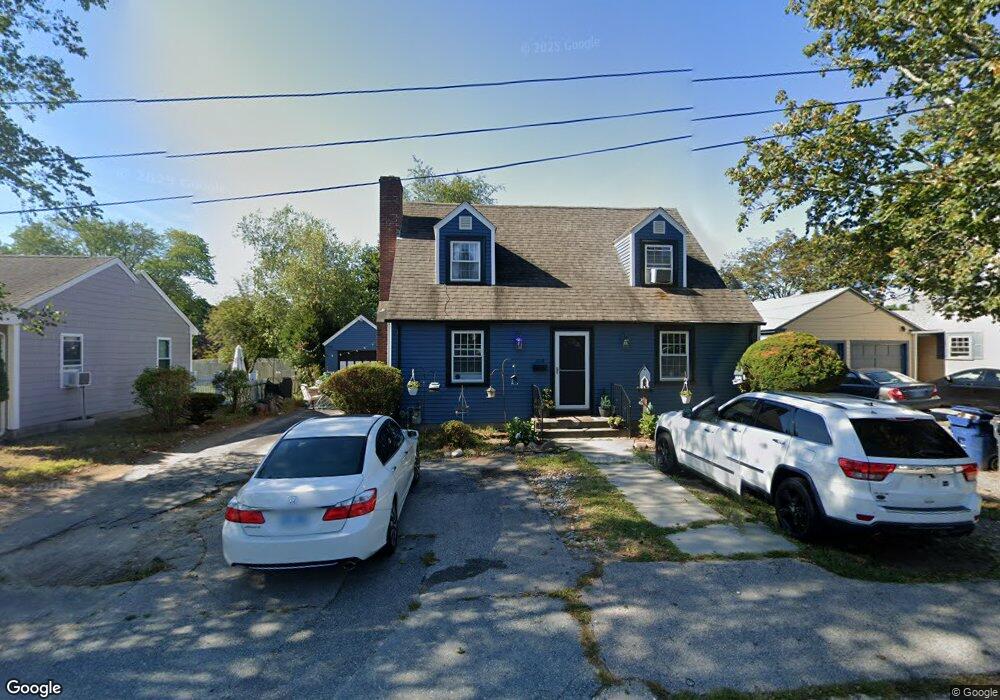
1038 Main Ave Warwick, RI 02886
Greenwood NeighborhoodEstimated Value: $368,000 - $444,000
3
Beds
2
Baths
1,943
Sq Ft
$213/Sq Ft
Est. Value
About This Home
This home is located at 1038 Main Ave, Warwick, RI 02886 and is currently estimated at $413,741, approximately $212 per square foot. 1038 Main Ave is a home located in Kent County with nearby schools including St Rose Of Lima School, Islamic School of Rhode Island, and St Joseph School.
Ownership History
Date
Name
Owned For
Owner Type
Purchase Details
Closed on
May 27, 2021
Sold by
Mason Frederick L
Bought by
Prestly Desarie
Current Estimated Value
Home Financials for this Owner
Home Financials are based on the most recent Mortgage that was taken out on this home.
Original Mortgage
$213,000
Outstanding Balance
$191,058
Interest Rate
3%
Mortgage Type
Purchase Money Mortgage
Estimated Equity
$222,683
Purchase Details
Closed on
Mar 11, 2004
Sold by
Anderson John G Est and Gray
Bought by
Mason 3Rd Frederick L
Create a Home Valuation Report for This Property
The Home Valuation Report is an in-depth analysis detailing your home's value as well as a comparison with similar homes in the area
Home Values in the Area
Average Home Value in this Area
Purchase History
We collect this data history from publicly available records. To have your information removed, we recommend requesting removal directly through your county’s website.
| Date | Buyer | Sale Price | Title Company |
|---|---|---|---|
| Prestly Desarie | $225,000 | None Available | |
| Mason 3Rd Frederick L | $210,000 | -- |
Source: Public Records
Mortgage History
We collect this data history from publicly available records. To have your information removed, we recommend requesting removal directly through your county’s website.
| Date | Status | Borrower | Loan Amount |
|---|---|---|---|
| Open | Prestly Desarie | $213,000 | |
| Previous Owner | Mason 3Rd Frederick L | $238,500 | |
| Previous Owner | Mason 3Rd Frederick L | $13,133 | |
| Previous Owner | Mason 3Rd Frederick L | $220,000 |
Source: Public Records
Tax History
| Year | Tax Paid | Tax Assessment Tax Assessment Total Assessment is a certain percentage of the fair market value that is determined by local assessors to be the total taxable value of land and additions on the property. | Land | Improvement |
|---|---|---|---|---|
| 2025 | $4,439 | $349,500 | $89,400 | $260,100 |
| 2024 | $4,261 | $294,500 | $77,800 | $216,700 |
| 2023 | $4,179 | $294,500 | $77,800 | $216,700 |
| 2022 | $3,755 | $200,500 | $51,300 | $149,200 |
| 2021 | $3,755 | $200,500 | $51,300 | $149,200 |
| 2020 | $3,755 | $200,500 | $51,300 | $149,200 |
| 2019 | $3,755 | $200,500 | $51,300 | $149,200 |
| 2018 | $3,645 | $174,400 | $56,400 | $118,000 |
| 2017 | $3,530 | $174,400 | $56,400 | $118,000 |
| 2016 | $3,530 | $174,400 | $56,400 | $118,000 |
| 2015 | $3,200 | $154,200 | $51,100 | $103,100 |
| 2014 | $3,093 | $154,200 | $51,100 | $103,100 |
| 2013 | $3,052 | $154,200 | $51,100 | $103,100 |
Source: Public Records
Map
Nearby Homes
- 45 Barren Hill Dr
- 833 Halifax Dr
- 875 Halifax Dr
- 83 Cadora Ave
- 81 Cadora Ave
- 661 Orleans Ct
- 220 Alvin St
- 66 Scenic Dr
- 58 Spooner Ave
- 124 Edaville Ct
- 32 Sunny View Ct
- 115 Edman St
- 2907 Post Rd Unit 2
- 2907 Post Rd Unit 1
- 2907 Post Rd Unit 3
- 2907 Post Rd Unit 7
- 2907 Post Rd Unit 8
- 2907 Post Rd Unit 6
- 2907 Post Rd Unit 4
- 139 Lancaster Ave
- 1044 Main Ave
- 293 Chapmans Ave
- 1060 Main Ave
- 1032 Main Ave
- 305 Chapmans Ave
- 279 Chapmans Ave
- 1074 Main Ave
- 191 Imperial Dr
- 1047 Main Ave
- 315 Chapmans Ave
- 1020 Main Ave
- 1080 Main Ave
- 292 Chapmans Ave
- 1057 Main Ave
- 300 Chapmans Ave
- 18 Freeman St
- 8 Freeman St
- 288 Chapmans Ave
- 321 Chapmans Ave
- 4 Freeman St
Your Personal Tour Guide
Ask me questions while you tour the home.