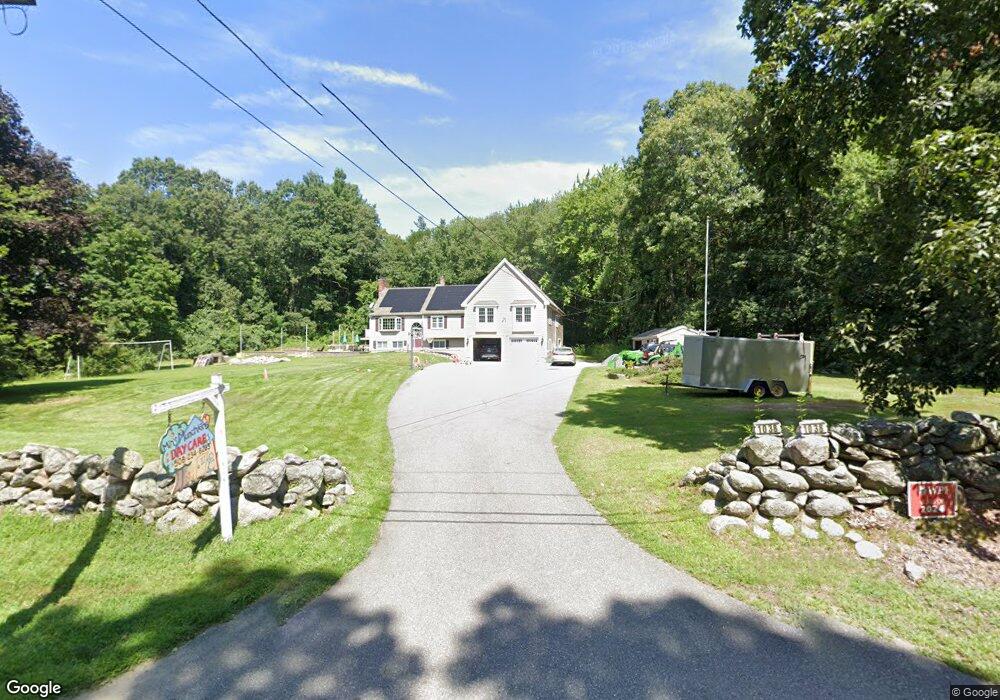
1038 Sutton St Northbridge, MA 01534
Estimated Value: $608,000 - $779,000
3
Beds
2
Baths
1,650
Sq Ft
$402/Sq Ft
Est. Value
About This Home
This home is located at 1038 Sutton St, Northbridge, MA 01534 and is currently estimated at $662,662, approximately $401 per square foot. 1038 Sutton St is a home located in Worcester County with nearby schools including Northbridge Elementary School, Northbridge Middle School, and Northbridge High School.
Ownership History
Date
Name
Owned For
Owner Type
Purchase Details
Closed on
Jun 26, 2023
Sold by
Battista John and Battista Melinda
Bought by
Spenser Thomas and Spenser Emily
Current Estimated Value
Purchase Details
Closed on
Nov 25, 2002
Sold by
Schell Andrew M
Bought by
Battista John and Battista Melinda
Home Financials for this Owner
Home Financials are based on the most recent Mortgage that was taken out on this home.
Original Mortgage
$51,000
Interest Rate
6.16%
Purchase Details
Closed on
Oct 28, 1999
Sold by
Turgeon Donald P and Turgeon Debra A
Bought by
Schell Andrew M
Purchase Details
Closed on
May 15, 1995
Sold by
Hashemizadeh Hamid and Hashemizadeh Tiina
Bought by
Turgeon Donald and Caya Debra
Purchase Details
Closed on
Jul 19, 1991
Sold by
Guillaume Donna M and Guillaume Ronald P
Bought by
Hashemizadeh Hamid and Hashemizadeh Tiina
Create a Home Valuation Report for This Property
The Home Valuation Report is an in-depth analysis detailing your home's value as well as a comparison with similar homes in the area
Home Values in the Area
Average Home Value in this Area
Purchase History
We collect this data history from publicly available records. To have your information removed, we recommend requesting removal directly through your county’s website.
| Date | Buyer | Sale Price | Title Company |
|---|---|---|---|
| Spenser Thomas | -- | None Available | |
| Spenser Thomas | -- | None Available | |
| Spenser Thomas | -- | None Available | |
| Battista John | $255,000 | -- | |
| Battista John | $255,000 | -- | |
| Schell Andrew M | $175,000 | -- | |
| Schell Andrew M | $175,000 | -- | |
| Turgeon Donald | $133,950 | -- | |
| Turgeon Donald | $133,950 | -- | |
| Hashemizadeh Hamid | $137,000 | -- | |
| Hashemizadeh Hamid | $137,000 | -- |
Source: Public Records
Mortgage History
We collect this data history from publicly available records. To have your information removed, we recommend requesting removal directly through your county’s website.
| Date | Status | Borrower | Loan Amount |
|---|---|---|---|
| Previous Owner | Hashemizadeh Hamid | $51,000 | |
| Previous Owner | Hashemizadeh Hamid | $204,000 |
Source: Public Records
Tax History
| Year | Tax Paid | Tax Assessment Tax Assessment Total Assessment is a certain percentage of the fair market value that is determined by local assessors to be the total taxable value of land and additions on the property. | Land | Improvement |
|---|---|---|---|---|
| 2025 | $6,861 | $581,900 | $156,600 | $425,300 |
| 2024 | $6,555 | $542,200 | $156,600 | $385,600 |
| 2023 | $6,753 | $521,100 | $156,600 | $364,500 |
| 2022 | $6,426 | $466,700 | $120,600 | $346,100 |
| 2021 | $8,540 | $433,900 | $115,000 | $318,900 |
| 2020 | $5,820 | $420,500 | $115,000 | $305,500 |
| 2019 | $2,602 | $403,600 | $115,000 | $288,600 |
| 2018 | $4,975 | $384,500 | $109,400 | $275,100 |
| 2017 | $4,929 | $364,300 | $109,400 | $254,900 |
| 2016 | $4,645 | $337,800 | $99,400 | $238,400 |
| 2015 | $4,136 | $309,100 | $99,400 | $209,700 |
| 2014 | $4,099 | $309,100 | $99,400 | $209,700 |
Source: Public Records
Map
Nearby Homes
- 320 Lincoln Cir
- 229 & 225 Providence Rd
- 22 Demers St Unit 1
- 22 Demers St Unit 2
- 82 Dodge Hill Rd
- 4 Brookmeadow Ln
- 1 Smith Rd
- 77 Fisherville Terrace
- 53 Fisherville Terrace
- 66 Fisherville Terrace
- 80 Fisherville Terrace
- 274 Providence Rd Unit 5
- 26 Summerfield Dr Unit 17
- 12 Summerfield Dr Unit 12
- 175 Armsby Rd
- 5 Okemo Ridge Rd
- 183 Pleasant St Unit 2
- 183 Pleasant St
- 2428-2430 Providence Rd
- 184 Pleasant St
- 1060 Sutton St
- 1006 Sutton St
- 1033 Sutton St
- 1082 Sutton St
- 1061 Sutton St
- 34 Chipper Hill Rd
- 54 Chipper Hill Rd
- 984 Sutton St
- 978 Sutton St
- 1087 Sutton St
- 76 Chipper Hill Rd
- 49 Chipper Hill Rd
- 1112 Sutton St
- 1041 Sutton St
- 1109 Sutton St
- 92 Chipper Hill Rd
- 950 Sutton St
- 953 Sutton St
- 73 Chipper Hill Rd
- 2 Central Turnpike
Your Personal Tour Guide
Ask me questions while you tour the home.