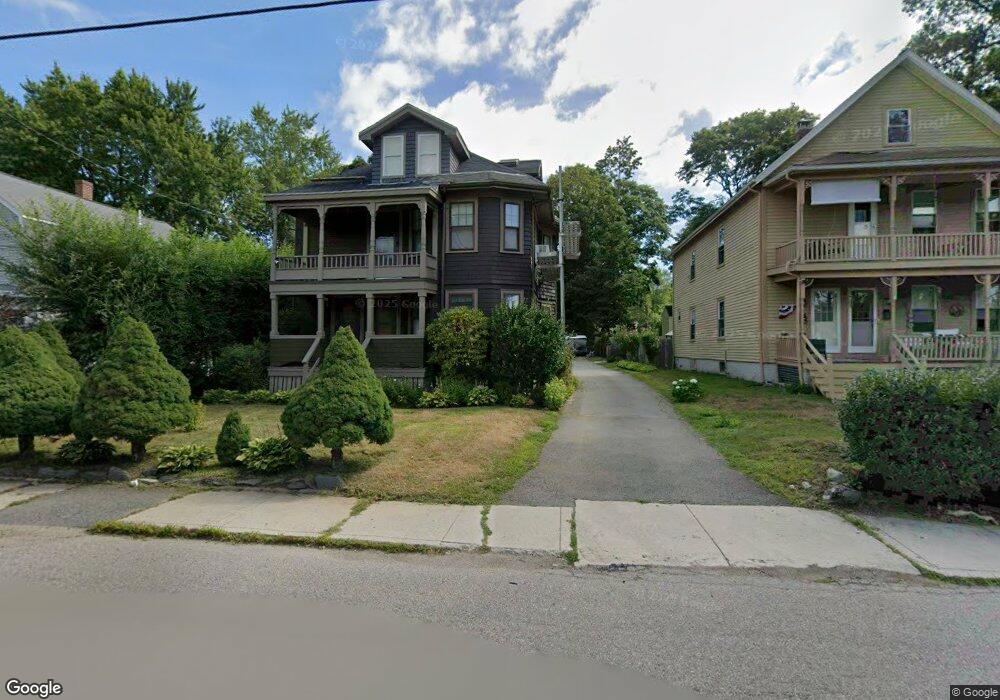
104 Smith St North Attleboro, MA 02760
Estimated Value: $496,417 - $823,000
4
Beds
2
Baths
1,990
Sq Ft
$311/Sq Ft
Est. Value
About This Home
This home is located at 104 Smith St, North Attleboro, MA 02760 and is currently estimated at $618,854, approximately $310 per square foot. 104 Smith St is a home located in Bristol County with nearby schools including North Attleboro High School and Discovery Daycare Center.
Ownership History
Date
Name
Owned For
Owner Type
Purchase Details
Closed on
Sep 30, 1998
Sold by
Lynch Roger
Bought by
Dahlbeck Rahcel E and Dahlbeck Kevin A
Current Estimated Value
Home Financials for this Owner
Home Financials are based on the most recent Mortgage that was taken out on this home.
Original Mortgage
$121,677
Outstanding Balance
$26,617
Interest Rate
6.89%
Mortgage Type
Purchase Money Mortgage
Estimated Equity
$592,237
Create a Home Valuation Report for This Property
The Home Valuation Report is an in-depth analysis detailing your home's value as well as a comparison with similar homes in the area
Home Values in the Area
Average Home Value in this Area
Purchase History
| Date | Buyer | Sale Price | Title Company |
|---|---|---|---|
| Dahlbeck Rahcel E | $122,000 | -- |
Source: Public Records
Mortgage History
| Date | Status | Borrower | Loan Amount |
|---|---|---|---|
| Open | Dahlbeck Rahcel E | $121,677 | |
| Previous Owner | Dahlbeck Rahcel E | $59,000 |
Source: Public Records
Tax History
| Year | Tax Paid | Tax Assessment Tax Assessment Total Assessment is a certain percentage of the fair market value that is determined by local assessors to be the total taxable value of land and additions on the property. | Land | Improvement |
|---|---|---|---|---|
| 2025 | $5,098 | $432,400 | $112,100 | $320,300 |
| 2024 | $4,885 | $423,300 | $112,100 | $311,200 |
| 2023 | $4,629 | $361,900 | $112,100 | $249,800 |
| 2022 | $4,873 | $349,800 | $112,100 | $237,700 |
| 2021 | $4,449 | $311,800 | $112,100 | $199,700 |
| 2020 | $3,989 | $278,000 | $112,100 | $165,900 |
| 2019 | $3,813 | $267,800 | $101,900 | $165,900 |
| 2018 | $3,123 | $234,100 | $101,900 | $132,200 |
| 2017 | $3,095 | $234,100 | $101,900 | $132,200 |
| 2016 | $2,754 | $208,300 | $113,300 | $95,000 |
| 2015 | $2,811 | $213,900 | $118,900 | $95,000 |
| 2014 | $2,827 | $213,500 | $110,000 | $103,500 |
Source: Public Records
Map
Nearby Homes
- 113 Reed Ave
- 6 Al Pace Dr Unit B
- 271 N Washington St
- 58 Reed Ave Unit 8
- 3 Riley Ct
- 200 Smith St
- 212 Fisher St Unit A15
- 212 Fisher St Unit A13
- 157 Fisher St
- 32-34 Columbia St
- 35-R Whiting St
- 31 Whiting St
- 86 Division St
- 835 Mount Hope St Unit 5
- 265 Park St Unit 1
- 52 High St
- 28 Church St
- 412 Broadway
- 77 Church St
- 16 Richards Ave Unit 306
Your Personal Tour Guide
Ask me questions while you tour the home.