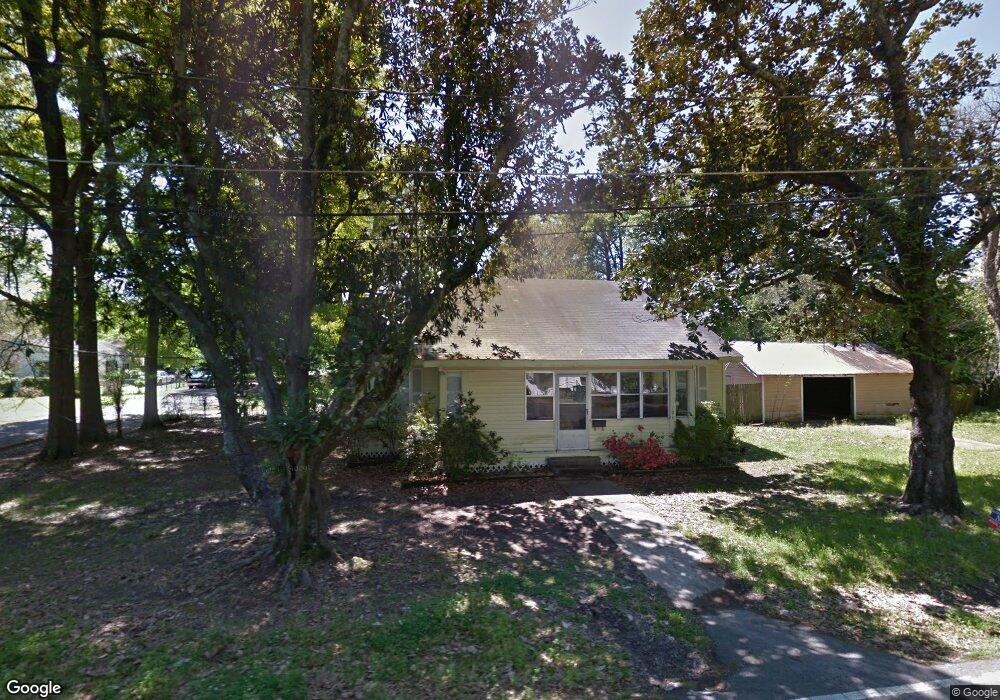
104 Thompson St West Monroe, LA 71292
Estimated Value: $28,000 - $59,000
3
Beds
1
Bath
1,347
Sq Ft
$36/Sq Ft
Est. Value
About This Home
This home is located at 104 Thompson St, West Monroe, LA 71292 and is currently estimated at $49,069, approximately $36 per square foot. 104 Thompson St is a home located in Ouachita Parish with nearby schools including Riverbend Elementary School, Riser Middle School, and West Monroe High School.
Ownership History
Date
Name
Owned For
Owner Type
Purchase Details
Closed on
Jun 7, 2018
Sold by
Russell Garrett L
Bought by
Buckshot Llc
Current Estimated Value
Purchase Details
Closed on
Jun 30, 2016
Sold by
Carr Properties Of Nela Llc
Bought by
Terry Garrett John
Purchase Details
Closed on
Jan 29, 2009
Sold by
U S Bank Na
Bought by
Carr Properties Of Nela Llc
Home Financials for this Owner
Home Financials are based on the most recent Mortgage that was taken out on this home.
Original Mortgage
$29,380
Interest Rate
5.06%
Mortgage Type
Future Advance Clause Open End Mortgage
Purchase Details
Closed on
Nov 7, 2005
Sold by
Delony M Lamar and Delony Jan Spurlock
Bought by
Lopez Jose Angel and Lopez Darla Loflin
Home Financials for this Owner
Home Financials are based on the most recent Mortgage that was taken out on this home.
Original Mortgage
$52,250
Interest Rate
8.5%
Mortgage Type
Adjustable Rate Mortgage/ARM
Create a Home Valuation Report for This Property
The Home Valuation Report is an in-depth analysis detailing your home's value as well as a comparison with similar homes in the area
Home Values in the Area
Average Home Value in this Area
Purchase History
We collect this data history from publicly available records. To have your information removed, we recommend requesting removal directly through your county’s website.
| Date | Buyer | Sale Price | Title Company |
|---|---|---|---|
| Buckshot Llc | $37,000 | -- | |
| Terry Garrett John | $42,000 | None Available | |
| Carr Properties Of Nela Llc | $28,000 | None Available | |
| Lopez Jose Angel | $55,000 | None Available |
Source: Public Records
Mortgage History
We collect this data history from publicly available records. To have your information removed, we recommend requesting removal directly through your county’s website.
| Date | Status | Borrower | Loan Amount |
|---|---|---|---|
| Previous Owner | Carr Properties Of Nela Llc | $29,380 | |
| Previous Owner | Lopez Jose Angel | $52,250 |
Source: Public Records
Tax History
| Year | Tax Paid | Tax Assessment Tax Assessment Total Assessment is a certain percentage of the fair market value that is determined by local assessors to be the total taxable value of land and additions on the property. | Land | Improvement |
|---|---|---|---|---|
| 2025 | $393 | $4,434 | $750 | $3,684 |
| 2024 | $393 | $5,500 | $880 | $4,620 |
| 2023 | $459 | $5,500 | $880 | $4,620 |
| 2022 | $450 | $5,500 | $880 | $4,620 |
| 2021 | $450 | $5,500 | $880 | $4,620 |
| 2020 | $450 | $5,500 | $880 | $4,620 |
| 2019 | $441 | $5,500 | $880 | $4,620 |
| 2018 | $441 | $5,500 | $880 | $4,620 |
| 2017 | $441 | $5,500 | $880 | $4,620 |
| 2016 | $441 | $5,500 | $880 | $4,620 |
| 2015 | $439 | $5,500 | $880 | $4,620 |
| 2014 | $439 | $5,500 | $880 | $4,620 |
| 2013 | $437 | $5,500 | $880 | $4,620 |
Source: Public Records
Map
Nearby Homes
- 210 Mitchell Ln
- 209 Lazarre Ave
- 101 Browning Ave
- 610 S 3rd St
- 208 Lazarre Ave
- 802 S 5th St
- 405 Austin Ave
- 306 Austin Ave
- 508 S 3rd St
- 300 Anderson St
- 604 S 5th St
- 404 Filhiol Ave
- 310 Hamilton St
- 700 S Grand St
- 802 S Grand St Unit 810 S Grand Street
- 708 S 7th St
- 208 Linderman Ave
- 311 Ludwig Ave
- 1206 Saint John St
- 107 Peach St
- 306 Mitchell Ln
- 300 Mitchell Ln
- 304 Mitchell Ln
- 208 Mitchell Ln
- 802 S 3rd St
- 800 S 3rd St
- 213 Stewart Ave
- 301 Mitchell Ln
- 303 Mitchell Ln
- 305 Mitchell Ln
- 204 Mitchell Ln
- 209 Mitchell Ln
- 205 Stewart Ave
- 207 Mitchell Ln
- 307 Mitchell Ln
- 300 Stewart Ave
- 307 Stewart Ave
- 205 Mitchell Ln
- 309 Mitchell Ln
- 308 Mitchell Ln
Your Personal Tour Guide
Ask me questions while you tour the home.