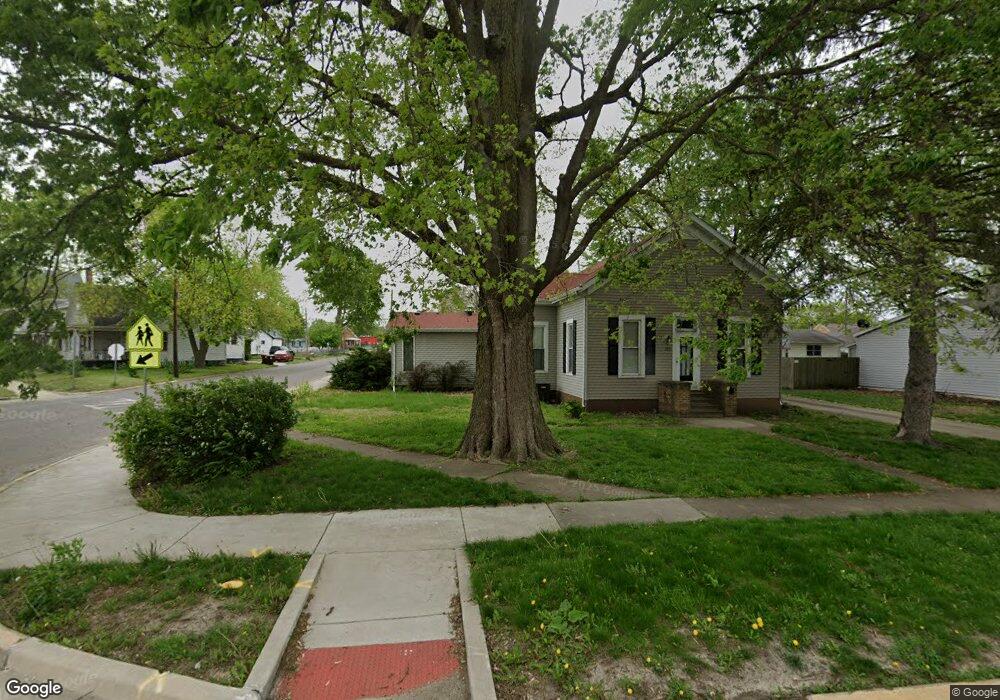
105 7th St Lincoln, IL 62656
Estimated Value: $137,000 - $167,375
2
Beds
--
Bath
1,992
Sq Ft
$75/Sq Ft
Est. Value
About This Home
This home is located at 105 7th St, Lincoln, IL 62656 and is currently estimated at $149,844, approximately $75 per square foot. 105 7th St is a home located in Logan County with nearby schools including Central Elementary School, Lincoln Junior High School, and Lincoln Community High School.
Ownership History
Date
Name
Owned For
Owner Type
Purchase Details
Closed on
Feb 4, 2011
Sold by
Kennett Rhonda J and Kennet Rhonda J
Bought by
Hutton David and Hutton Patricia
Current Estimated Value
Home Financials for this Owner
Home Financials are based on the most recent Mortgage that was taken out on this home.
Original Mortgage
$88,205
Outstanding Balance
$61,322
Interest Rate
5.12%
Mortgage Type
FHA
Estimated Equity
$88,522
Purchase Details
Closed on
Jun 4, 2010
Sold by
Kennett Rhonda J and Kennett Ezekiel D
Bought by
Kennet Rhonda J
Create a Home Valuation Report for This Property
The Home Valuation Report is an in-depth analysis detailing your home's value as well as a comparison with similar homes in the area
Home Values in the Area
Average Home Value in this Area
Purchase History
| Date | Buyer | Sale Price | Title Company |
|---|---|---|---|
| Hutton David | $90,500 | -- | |
| Kennet Rhonda J | -- | -- |
Source: Public Records
Mortgage History
| Date | Status | Borrower | Loan Amount |
|---|---|---|---|
| Open | Hutton David | $88,205 |
Source: Public Records
Tax History
| Year | Tax Paid | Tax Assessment Tax Assessment Total Assessment is a certain percentage of the fair market value that is determined by local assessors to be the total taxable value of land and additions on the property. | Land | Improvement |
|---|---|---|---|---|
| 2024 | $3,920 | $43,340 | $9,960 | $33,380 |
| 2023 | $3,742 | $40,130 | $9,220 | $30,910 |
| 2022 | $2,570 | $37,420 | $8,600 | $28,820 |
| 2021 | $2,443 | $36,030 | $8,280 | $27,750 |
| 2020 | $2,447 | $36,030 | $8,280 | $27,750 |
| 2019 | $2,375 | $35,330 | $8,120 | $27,210 |
| 2018 | $2,271 | $33,970 | $7,810 | $26,160 |
| 2017 | $2,751 | $33,970 | $7,810 | $26,160 |
| 2016 | $3,297 | $34,370 | $7,900 | $26,470 |
| 2015 | $3,094 | $33,070 | $7,620 | $25,450 |
| 2014 | $3,094 | $33,070 | $7,620 | $25,450 |
| 2013 | $3,094 | $30,520 | $7,030 | $23,490 |
| 2012 | $3,094 | $30,960 | $7,130 | $23,830 |
Source: Public Records
Map
Nearby Homes
Your Personal Tour Guide
Ask me questions while you tour the home.