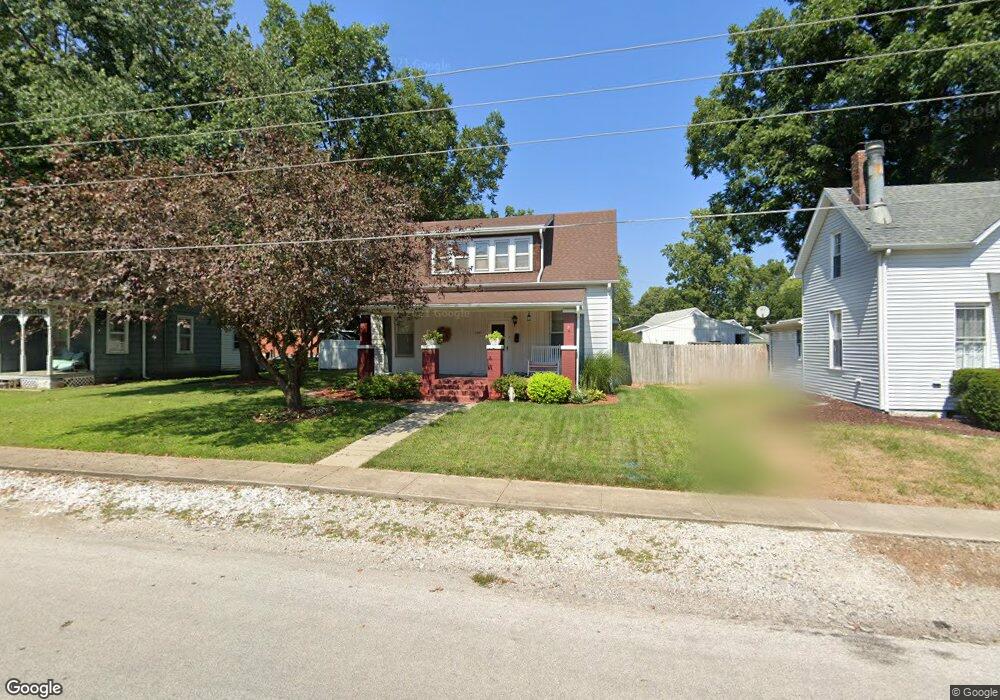
105 E Apple St Freeburg, IL 62243
Estimated Value: $153,000 - $255,000
Studio
--
Bath
896
Sq Ft
$223/Sq Ft
Est. Value
About This Home
This home is located at 105 E Apple St, Freeburg, IL 62243 and is currently estimated at $199,756, approximately $222 per square foot. 105 E Apple St is a home located in St. Clair County with nearby schools including Freeburg Elementary School, Freeburg Community High School, and St. Joseph Catholic School.
Ownership History
Date
Name
Owned For
Owner Type
Purchase Details
Closed on
Jul 30, 2021
Sold by
Grau Jacob and Grau Brettney
Bought by
Sinasky Drew A and Sinasky Katherine H
Current Estimated Value
Home Financials for this Owner
Home Financials are based on the most recent Mortgage that was taken out on this home.
Original Mortgage
$136,363
Outstanding Balance
$124,052
Interest Rate
2.93%
Mortgage Type
New Conventional
Estimated Equity
$75,704
Purchase Details
Closed on
Dec 15, 2000
Bought by
Mecklenburg John and Mecklenburg Elizabeth
Create a Home Valuation Report for This Property
The Home Valuation Report is an in-depth analysis detailing your home's value as well as a comparison with similar homes in the area
Home Values in the Area
Average Home Value in this Area
Purchase History
| Date | Buyer | Sale Price | Title Company |
|---|---|---|---|
| Sinasky Drew A | $135,000 | Advanced Title Solutions | |
| Mecklenburg John | $105,000 | -- |
Source: Public Records
Mortgage History
| Date | Status | Borrower | Loan Amount |
|---|---|---|---|
| Open | Sinasky Drew A | $136,363 |
Source: Public Records
Tax History
| Year | Tax Paid | Tax Assessment Tax Assessment Total Assessment is a certain percentage of the fair market value that is determined by local assessors to be the total taxable value of land and additions on the property. | Land | Improvement |
|---|---|---|---|---|
| 2024 | $5,874 | $76,251 | $6,738 | $69,513 |
| 2023 | $5,668 | $72,838 | $6,504 | $66,334 |
| 2022 | $5,395 | $68,251 | $6,094 | $62,157 |
| 2021 | $5,195 | $64,254 | $5,737 | $58,517 |
| 2020 | $4,930 | $58,454 | $5,219 | $53,235 |
| 2019 | $4,653 | $57,822 | $5,395 | $52,427 |
| 2018 | $4,569 | $57,058 | $5,324 | $51,734 |
| 2017 | $4,351 | $54,554 | $5,090 | $49,464 |
| 2016 | $4,294 | $52,285 | $4,878 | $47,407 |
| 2014 | $3,803 | $52,444 | $5,006 | $47,438 |
| 2013 | $3,471 | $51,976 | $4,961 | $47,015 |
Source: Public Records
Map
Nearby Homes
- 10 E Washington St
- 108 S Vine St
- 102 S Monroe St
- 203 Elizabeth Dr
- 0 Tract 10 &11 Cemetery Barber Rd Unit MIS26011722
- 701 N Edison St
- 424 Firestone St
- 14 Lakeview Dr
- 103 Draco Dr
- 0 Hickory Dr
- 109 Willow Dr
- 111 Willow Dr
- 420 Foxtail Dr
- 440 Foxtail Dr
- 433 Foxtail Dr
- 359 Sleeping Indian Dr
- 363 Sleeping Indian Dr
- 222 Alamosa Dr
- 416 Telluride Dr
- 3.31 Acres Hertel School (White Oaks Club) Rd
- 101 E Apple St
- 109 E Apple St
- 8 E Washington St
- 211 S State St
- 205 S State St
- 113 E Apple St
- 106 E Apple St
- 104 E Apple St
- 108 E Apple St
- 112 E Apple St
- 100 E Washington St
- 208 S Cherry St
- 114 E Apple St
- 204 S Cherry St
- 11 E Washington St
- 111 S Edison St
- 105 E Emily St
- 101 E Emily St
- 311 S State St
- 107 E Emily St
Your Personal Tour Guide
Ask me questions while you tour the home.