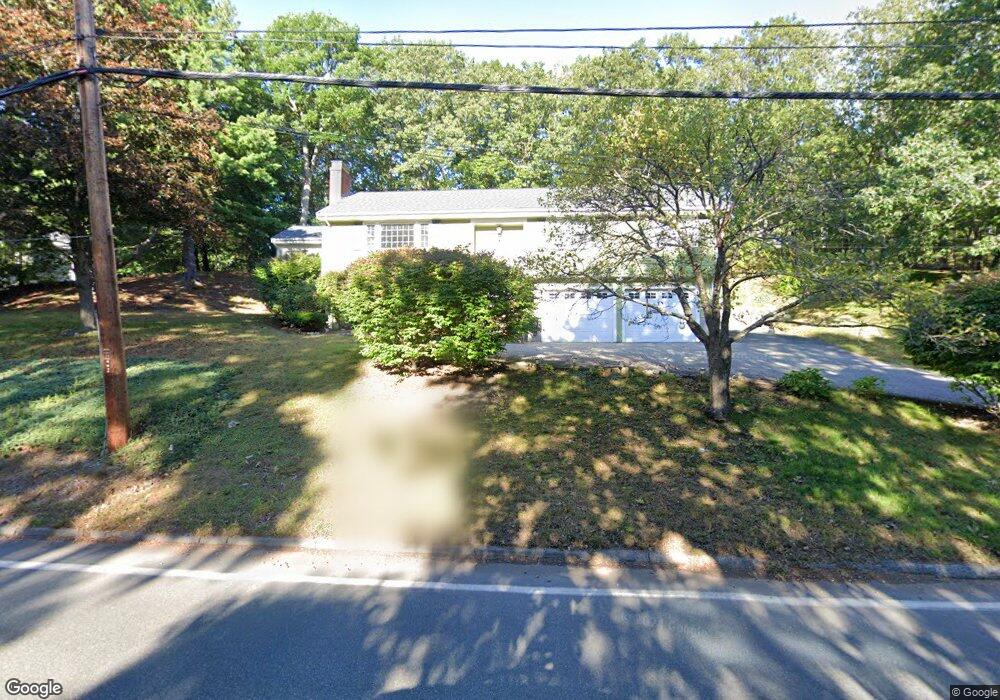
105 Ridge St Winchester, MA 01890
West Side NeighborhoodEstimated Value: $1,123,000 - $1,337,691
3
Beds
3
Baths
2,200
Sq Ft
$547/Sq Ft
Est. Value
About This Home
This home is located at 105 Ridge St, Winchester, MA 01890 and is currently estimated at $1,202,423, approximately $546 per square foot. 105 Ridge St is a home located in Middlesex County with nearby schools including Vinson-Owen Elementary School, McCall Middle School, and Winchester High School.
Ownership History
Date
Name
Owned For
Owner Type
Purchase Details
Closed on
Feb 4, 2021
Sold by
Chang Ivan C and Chang Chinhong L
Bought by
Sim Yong C and Sim Helena J
Current Estimated Value
Home Financials for this Owner
Home Financials are based on the most recent Mortgage that was taken out on this home.
Original Mortgage
$689,520
Outstanding Balance
$615,629
Interest Rate
2.6%
Mortgage Type
Purchase Money Mortgage
Estimated Equity
$586,794
Purchase Details
Closed on
Mar 4, 2005
Sold by
Oneil Gloria T
Bought by
Chang Chinhong L and Chang Ivan C
Home Financials for this Owner
Home Financials are based on the most recent Mortgage that was taken out on this home.
Original Mortgage
$480,000
Interest Rate
5.66%
Mortgage Type
Purchase Money Mortgage
Create a Home Valuation Report for This Property
The Home Valuation Report is an in-depth analysis detailing your home's value as well as a comparison with similar homes in the area
Home Values in the Area
Average Home Value in this Area
Purchase History
| Date | Buyer | Sale Price | Title Company |
|---|---|---|---|
| Sim Yong C | $880,000 | None Available | |
| Chang Chinhong L | $600,000 | -- |
Source: Public Records
Mortgage History
| Date | Status | Borrower | Loan Amount |
|---|---|---|---|
| Open | Sim Yong C | $689,520 | |
| Previous Owner | Chang Chinhong L | $480,000 |
Source: Public Records
Tax History
| Year | Tax Paid | Tax Assessment Tax Assessment Total Assessment is a certain percentage of the fair market value that is determined by local assessors to be the total taxable value of land and additions on the property. | Land | Improvement |
|---|---|---|---|---|
| 2025 | $125 | $1,130,600 | $801,700 | $328,900 |
| 2024 | $12,337 | $1,088,900 | $761,700 | $327,200 |
| 2023 | $11,109 | $941,400 | $661,700 | $279,700 |
| 2022 | $11,179 | $893,600 | $601,600 | $292,000 |
| 2021 | $10,438 | $813,600 | $521,600 | $292,000 |
| 2020 | $9,957 | $803,600 | $511,600 | $292,000 |
| 2019 | $9,126 | $753,600 | $461,600 | $292,000 |
| 2018 | $8,869 | $727,600 | $439,600 | $288,000 |
| 2017 | $8,758 | $713,200 | $439,600 | $273,600 |
| 2016 | $8,180 | $700,300 | $431,600 | $268,700 |
| 2015 | $7,914 | $651,900 | $401,600 | $250,300 |
| 2014 | $8,029 | $634,200 | $391,600 | $242,600 |
Source: Public Records
Map
Nearby Homes
Your Personal Tour Guide
Ask me questions while you tour the home.