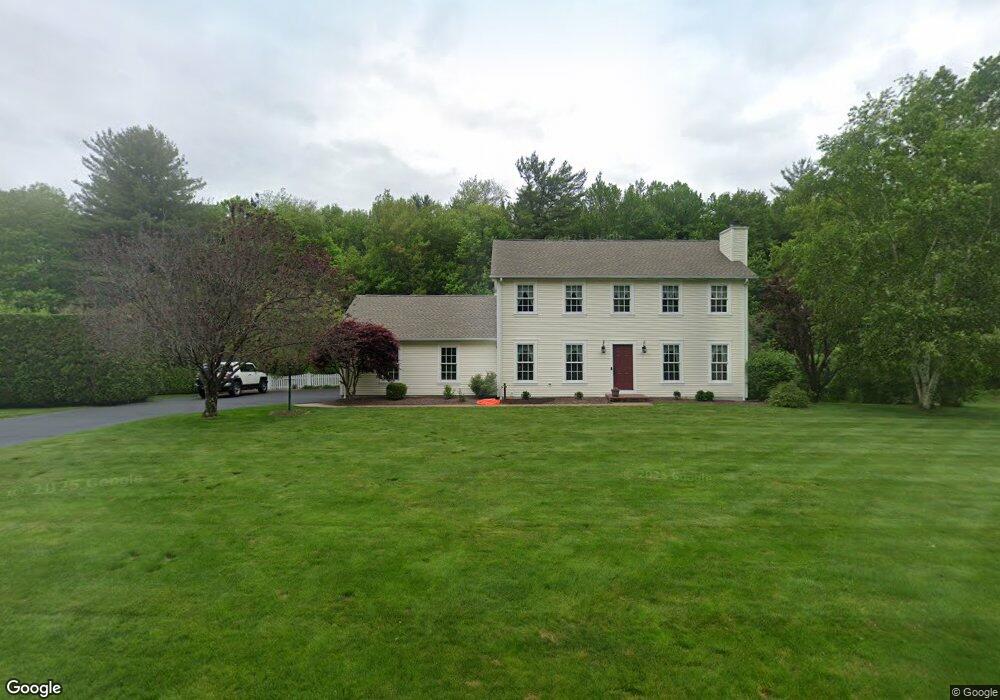
105 Whitaker Rd Westfield, MA 01085
Estimated Value: $411,000 - $551,000
3
Beds
2
Baths
1,756
Sq Ft
$281/Sq Ft
Est. Value
About This Home
This home is located at 105 Whitaker Rd, Westfield, MA 01085 and is currently estimated at $493,012, approximately $280 per square foot. 105 Whitaker Rd is a home located in Hampden County with nearby schools including Westfield High School and Saint Mary High School.
Ownership History
Date
Name
Owned For
Owner Type
Purchase Details
Closed on
Jul 31, 1997
Sold by
Francis Wheeler Constr
Bought by
Harrington Mark C and Harrington Kathleen
Current Estimated Value
Home Financials for this Owner
Home Financials are based on the most recent Mortgage that was taken out on this home.
Original Mortgage
$136,350
Outstanding Balance
$14,539
Interest Rate
7.55%
Mortgage Type
Purchase Money Mortgage
Estimated Equity
$478,473
Create a Home Valuation Report for This Property
The Home Valuation Report is an in-depth analysis detailing your home's value as well as a comparison with similar homes in the area
Home Values in the Area
Average Home Value in this Area
Purchase History
| Date | Buyer | Sale Price | Title Company |
|---|---|---|---|
| Harrington Mark C | $151,500 | -- |
Source: Public Records
Mortgage History
| Date | Status | Borrower | Loan Amount |
|---|---|---|---|
| Open | Harrington Mark C | $40,000 | |
| Closed | Harrington Mark C | $12,000 | |
| Open | Harrington Mark C | $136,350 |
Source: Public Records
Tax History
| Year | Tax Paid | Tax Assessment Tax Assessment Total Assessment is a certain percentage of the fair market value that is determined by local assessors to be the total taxable value of land and additions on the property. | Land | Improvement |
|---|---|---|---|---|
| 2025 | $6,309 | $415,600 | $139,500 | $276,100 |
| 2024 | $6,326 | $396,100 | $127,300 | $268,800 |
| 2023 | $5,954 | $363,800 | $121,200 | $242,600 |
| 2022 | $5,954 | $322,000 | $107,700 | $214,300 |
| 2021 | $5,774 | $305,800 | $101,600 | $204,200 |
| 2020 | $5,767 | $299,600 | $101,600 | $198,000 |
| 2019 | $5,643 | $286,900 | $96,800 | $190,100 |
| 2018 | $5,554 | $286,900 | $96,800 | $190,100 |
| 2017 | $5,441 | $280,200 | $98,100 | $182,100 |
| 2016 | $5,447 | $280,200 | $98,100 | $182,100 |
| 2015 | $4,889 | $263,700 | $98,100 | $165,600 |
| 2014 | $3,658 | $263,700 | $98,100 | $165,600 |
Source: Public Records
Map
Nearby Homes
- 85 City View Blvd
- 150 City View Rd
- 12 Woodland Rd
- 324 Russell Rd Unit 109
- 26 Hayre St
- 180 Russell Rd
- 82 S Maple St Unit 31
- 70 S Maple St
- 64 Brookline Ave
- 274 Prospect Street Extension
- 20 Perkins St
- 238 Prospect Street Extension
- 16 Squawfield Rd
- 404 Southwick Rd Unit 4
- 2 Sugar Maple Ln
- 45 Honey Pot Rd
- 44 Tannery Rd
- 13 Hampden St
- 13 Green Ave
- 19 Kellogg St
Your Personal Tour Guide
Ask me questions while you tour the home.