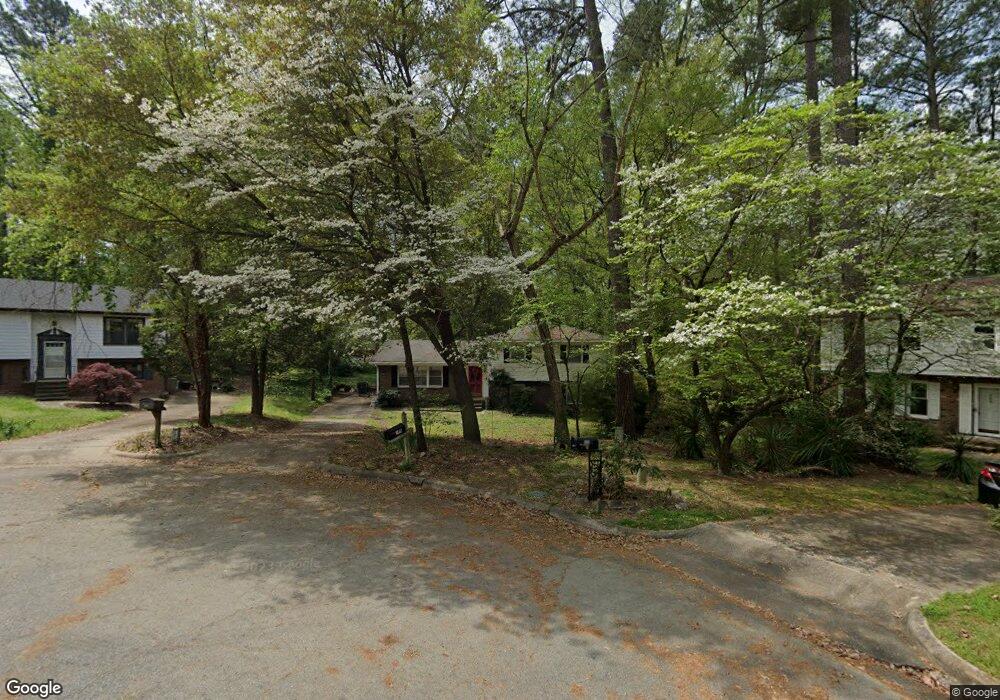
105 York Ct Garner, NC 27529
Estimated Value: $335,004 - $382,000
4
Beds
3
Baths
1,849
Sq Ft
$192/Sq Ft
Est. Value
About This Home
This home is located at 105 York Ct, Garner, NC 27529 and is currently estimated at $355,751, approximately $192 per square foot. 105 York Ct is a home located in Wake County with nearby schools including Aversboro Elementary, East Garner Middle School, and Garner High.
Ownership History
Date
Name
Owned For
Owner Type
Purchase Details
Closed on
Jul 16, 2024
Sold by
Chadwick Gina and Chadwick Geoffrey
Bought by
Chadwick Family Trust and Chadwick
Current Estimated Value
Purchase Details
Closed on
Jan 30, 2017
Sold by
Delsalto Norma
Bought by
Delsalto Norma and Chadwick Gina
Purchase Details
Closed on
Dec 21, 2016
Sold by
Escamilla Robert James and Pearl Janeth
Bought by
Salto Norma Del
Purchase Details
Closed on
Dec 20, 2002
Sold by
Escamilla Janet Palmer and Escamilla Janet P
Bought by
Escamilla Robert James
Home Financials for this Owner
Home Financials are based on the most recent Mortgage that was taken out on this home.
Original Mortgage
$101,000
Interest Rate
5%
Purchase Details
Closed on
May 25, 1993
Bought by
Escamilla Robert James
Create a Home Valuation Report for This Property
The Home Valuation Report is an in-depth analysis detailing your home's value as well as a comparison with similar homes in the area
Home Values in the Area
Average Home Value in this Area
Purchase History
We collect this data history from publicly available records. To have your information removed, we recommend requesting removal directly through your county’s website.
| Date | Buyer | Sale Price | Title Company |
|---|---|---|---|
| Chadwick Family Trust | -- | None Listed On Document | |
| Delsalto Norma | -- | None Available | |
| Salto Norma Del | $135,500 | None Available | |
| Escamilla Robert James | -- | -- | |
| Escamilla Robert James | $85,000 | -- |
Source: Public Records
Mortgage History
We collect this data history from publicly available records. To have your information removed, we recommend requesting removal directly through your county’s website.
| Date | Status | Borrower | Loan Amount |
|---|---|---|---|
| Previous Owner | Escamilla Robert James | $101,000 |
Source: Public Records
Tax History
| Year | Tax Paid | Tax Assessment Tax Assessment Total Assessment is a certain percentage of the fair market value that is determined by local assessors to be the total taxable value of land and additions on the property. | Land | Improvement |
|---|---|---|---|---|
| 2025 | $2,963 | $283,784 | $120,000 | $163,784 |
| 2024 | $2,953 | $283,784 | $120,000 | $163,784 |
| 2023 | $2,385 | $184,167 | $63,000 | $121,167 |
| 2022 | $2,178 | $184,167 | $63,000 | $121,167 |
| 2021 | $2,068 | $184,167 | $63,000 | $121,167 |
| 2020 | $2,040 | $184,167 | $63,000 | $121,167 |
| 2019 | $1,948 | $150,563 | $50,000 | $100,563 |
| 2018 | $1,807 | $150,563 | $50,000 | $100,563 |
| 2017 | $1,748 | $150,563 | $50,000 | $100,563 |
| 2016 | $1,726 | $150,563 | $50,000 | $100,563 |
| 2015 | $1,659 | $144,758 | $44,000 | $100,758 |
| 2014 | $1,580 | $144,758 | $44,000 | $100,758 |
Source: Public Records
Map
Nearby Homes
- 1311 Brucemont Dr
- 200 Coachman Dr
- 1504 Woods Creek Dr
- 152 Roebuck Ln
- 132 Carriage House Trail
- 602 Kimberwood Ct
- 170 Gilder Woods Dr
- 117 Village Green Trail
- 224 Shady Hollow Ln
- 134 Towne View Trail
- 520 Easy Wind Ln
- 296 Easy Wind Ln
- 103 Upton Ct
- 224 Myatt Fern Dr
- 216 Myatt Fern Dr
- 102 Rhum Place
- 102 Upton Ct
- 172 Wellons Creek Dr
- 100 Mcnaughton Ct
- 1408 Edgebrook Dr
- 104 York Ct
- 103 York Ct
- 106 Chatham Ct
- 102 York Ct
- 104 Chatham Ct
- 1300 Brucemont Dr
- 1302 Brucemont Dr
- 100 York Ct
- 105 Chatham Ct
- 1304 Brucemont Dr
- 102 Chatham Ct
- 1303 Buckingham Rd
- 1306 Brucemont Dr
- 1200 Brucemont Dr
- 103 Chatham Ct
- 1305 Buckingham Rd
- 1301 Buckingham Rd
- 1108 Timber Dr
- 1106 Timber Dr
- 1104 Timber Dr
Your Personal Tour Guide
Ask me questions while you tour the home.