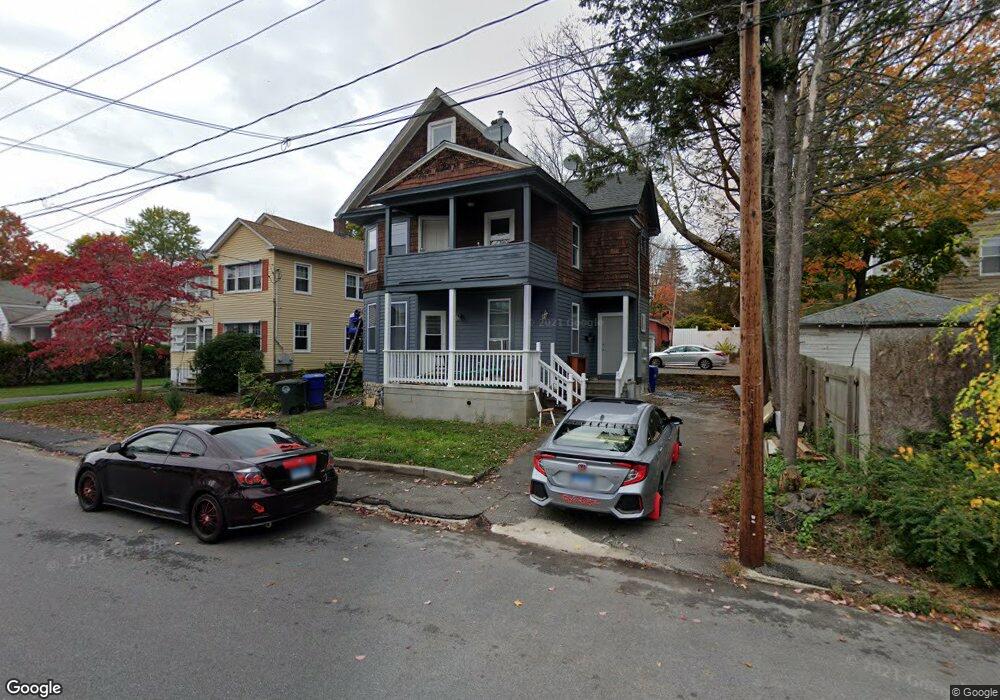
106 Berry St Torrington, CT 06790
Estimated Value: $236,407 - $347,000
About This Home
This home is located at 106 Berry St, Torrington, CT 06790 and is currently estimated at $285,602, approximately $139 per square foot. 106 Berry St is a home located in Litchfield County with nearby schools including Torrington Middle School, Torrington High School, and St. John Paul the Great Academy.
Ownership History
We collect this data history from publicly available records. To have your information removed, we recommend requesting removal directly through your county’s website.
Purchase Details
Purchase Details
Purchase Details
Home Financials for this Owner
Home Financials are based on the most recent Mortgage that was taken out on this home.Home Values in the Area
Average Home Value in this Area
Purchase History
We collect this data history from publicly available records. To have your information removed, we recommend requesting removal directly through your county’s website.
| Date | Buyer | Sale Price | Title Company |
|---|---|---|---|
| -- | -- | ||
| $19,930 | -- | ||
| $42,000 | -- |
Mortgage History
We collect this data history from publicly available records. To have your information removed, we recommend requesting removal directly through your county’s website.
| Date | Status | Borrower | Loan Amount |
|---|---|---|---|
| Previous Owner | $36,226 |
Tax History
We collect this data history from publicly available records. To have your information removed, we recommend requesting removal directly through your county’s website.
| Year | Tax Paid | Tax Assessment Tax Assessment Total Assessment is a certain percentage of the fair market value that is determined by local assessors to be the total taxable value of land and additions on the property. | Land | Improvement |
|---|---|---|---|---|
| 2025 | $6,225 | $161,910 | $19,320 | $142,590 |
| 2024 | $3,357 | $69,990 | $19,320 | $50,670 |
| 2023 | $3,357 | $69,990 | $19,320 | $50,670 |
| 2022 | $3,299 | $69,990 | $19,320 | $50,670 |
| 2021 | $3,231 | $69,990 | $19,320 | $50,670 |
| 2020 | $3,231 | $69,990 | $19,320 | $50,670 |
| 2019 | $2,337 | $50,620 | $19,320 | $31,300 |
| 2018 | $2,337 | $50,620 | $19,320 | $31,300 |
| 2017 | $2,316 | $50,620 | $19,320 | $31,300 |
| 2016 | $2,316 | $50,620 | $19,320 | $31,300 |
| 2015 | $2,316 | $50,620 | $19,320 | $31,300 |
| 2014 | $1,312 | $36,120 | $23,520 | $12,600 |
Map
- 368 Migeon Ave
- 150 Woodbine St
- 48 Dewey St
- 105 Pulaski St
- 141 Riverside Ave
- 43 Evans St
- 493 Migeon Ave
- 243 N Elm St
- 57 Workman Ave
- 118 Migeon Ave
- 0 Red Mountain Ave
- 25 High St
- 616 Migeon Ave Unit 9
- 29 Whiting Ave
- 17 Hawthorne Terrace
- 86 Washington Ave
- 84 Chestnut Ave
- 243 Roberts St
- 439 Prospect St
- 524 Prospect St
Ask me questions while you tour the home.