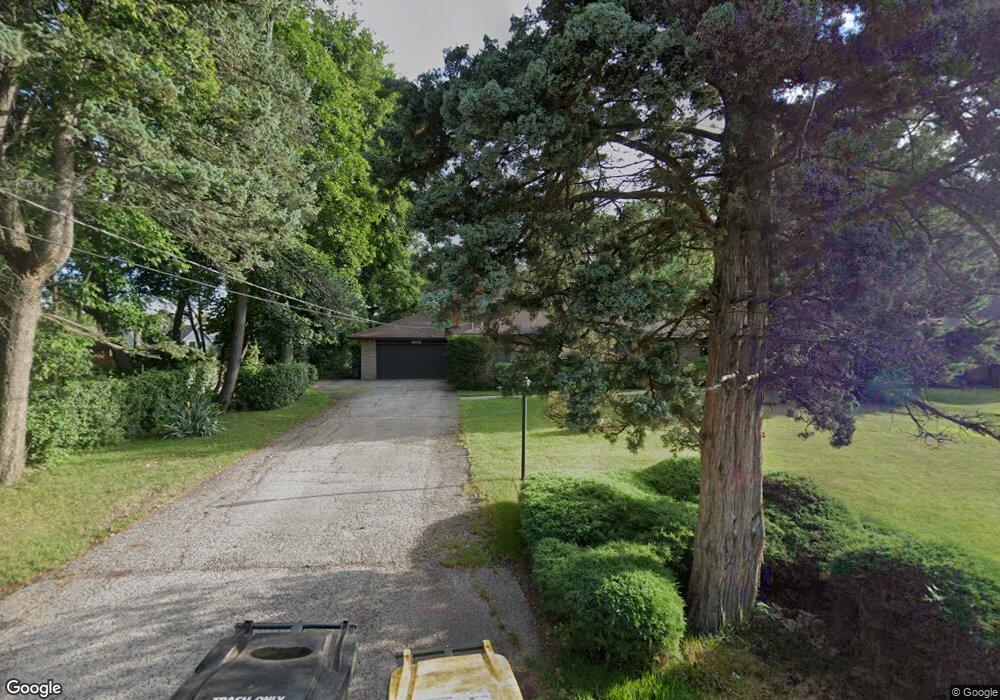
106 E Olive Ave Prospect Heights, IL 60070
Estimated Value: $802,000 - $837,714
4
Beds
3
Baths
4,055
Sq Ft
$201/Sq Ft
Est. Value
About This Home
This home is located at 106 E Olive Ave, Prospect Heights, IL 60070 and is currently estimated at $813,429, approximately $200 per square foot. 106 E Olive Ave is a home located in Cook County with nearby schools including Dwight D Eisenhower Elementary School, Anne Sullivan Elementary School, and Betsy Ross Elementary School.
Ownership History
Date
Name
Owned For
Owner Type
Purchase Details
Closed on
Nov 22, 1996
Sold by
Newboe John R
Bought by
Kuntz Scott C and Kuntz Dawn M
Current Estimated Value
Home Financials for this Owner
Home Financials are based on the most recent Mortgage that was taken out on this home.
Original Mortgage
$200,000
Outstanding Balance
$15,683
Interest Rate
8.12%
Estimated Equity
$797,746
Purchase Details
Closed on
Nov 19, 1996
Sold by
Newboe Elizabeth S
Bought by
Kuntz Scott C and Kuntz Dawn M
Home Financials for this Owner
Home Financials are based on the most recent Mortgage that was taken out on this home.
Original Mortgage
$200,000
Outstanding Balance
$15,683
Interest Rate
8.12%
Estimated Equity
$797,746
Create a Home Valuation Report for This Property
The Home Valuation Report is an in-depth analysis detailing your home's value as well as a comparison with similar homes in the area
Home Values in the Area
Average Home Value in this Area
Purchase History
| Date | Buyer | Sale Price | Title Company |
|---|---|---|---|
| Kuntz Scott C | $177,500 | -- | |
| Kuntz Scott C | $177,500 | -- |
Source: Public Records
Mortgage History
| Date | Status | Borrower | Loan Amount |
|---|---|---|---|
| Open | Kuntz Scott C | $200,000 |
Source: Public Records
Tax History
| Year | Tax Paid | Tax Assessment Tax Assessment Total Assessment is a certain percentage of the fair market value that is determined by local assessors to be the total taxable value of land and additions on the property. | Land | Improvement |
|---|---|---|---|---|
| 2025 | $16,135 | $74,000 | $14,850 | $59,150 |
| 2024 | $16,135 | $57,000 | $11,880 | $45,120 |
| 2023 | $15,098 | $57,000 | $11,880 | $45,120 |
| 2022 | $15,098 | $57,000 | $11,880 | $45,120 |
| 2021 | $16,350 | $53,193 | $10,395 | $42,798 |
| 2020 | $15,906 | $53,193 | $10,395 | $42,798 |
| 2019 | $15,893 | $59,501 | $10,395 | $49,106 |
| 2018 | $13,622 | $47,500 | $8,910 | $38,590 |
| 2017 | $13,487 | $47,500 | $8,910 | $38,590 |
| 2016 | $12,804 | $47,500 | $8,910 | $38,590 |
| 2015 | $14,812 | $49,767 | $7,425 | $42,342 |
| 2014 | $14,673 | $49,767 | $7,425 | $42,342 |
| 2013 | $14,294 | $49,767 | $7,425 | $42,342 |
Source: Public Records
Map
Nearby Homes
- 206 E Camp Mcdonald Rd
- 304 E Camp Mcdonald Rd
- 206 Elm St
- 1454 N Elmhurst Rd Unit 102B
- 306 Lonsdale Rd
- 1975 Merlot Ct
- 501 Aberdeen Ln Unit C
- 101 N Schoenbeck Rd
- 584 Edinburgh Ln Unit A
- 1414 N Bridgeport Dr Unit T31
- 55 Willow Rd
- 802 Andover Ct
- 1575 Sandpebble Dr Unit 104
- 1550 Sandpebble Dr Unit 209
- 1525 Sander Ct Unit 113
- 1525 Sander Ct Unit 108
- 1525 Sander Ct Unit 103
- 513 Green Bridge Ln Unit B
- 1240 N Boxwood Dr
- 1404 Plum Ct Unit C
- 108 E Olive Ave
- 103 Hillside Ave
- 105 Hillside Ave
- 110 E Olive Ave
- 104 E Olive Ave
- 107 Hillside Ave
- 107 E Olive Ave
- 109 E Olive Ave
- 105 E Olive Ave
- 109 Hillside Ave
- 111 E Olive Ave
- 103 E Olive Ave
- 200 E Olive Ave
- 109 E Marion Ave
- 111 Hillside Ave
- 101 E Olive Ave
- 111 E Marion Ave
- 202 E Olive Ave
- 201 E Olive Ave
- 201 E Marion Ave
Your Personal Tour Guide
Ask me questions while you tour the home.