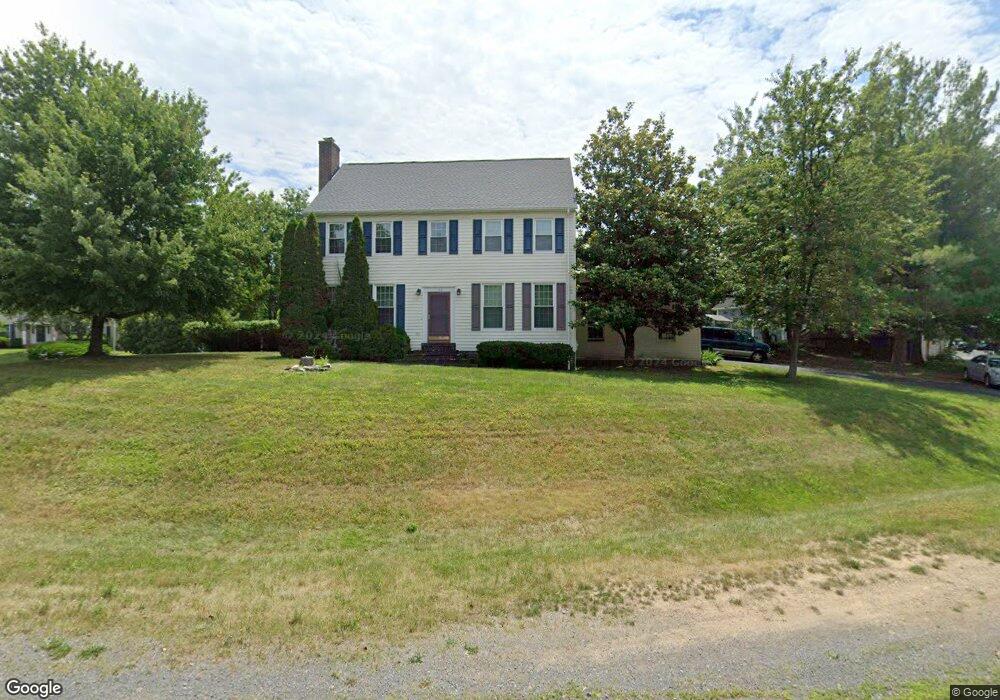
106 Evette Place Winchester, VA 22602
Estimated Value: $428,393 - $484,000
4
Beds
3
Baths
2,220
Sq Ft
$209/Sq Ft
Est. Value
About This Home
This home is located at 106 Evette Place, Winchester, VA 22602 and is currently estimated at $463,348, approximately $208 per square foot. 106 Evette Place is a home located in Frederick County with nearby schools including Redbud Run Elementary School, James Wood Middle School, and Millbrook High School.
Ownership History
Date
Name
Owned For
Owner Type
Purchase Details
Closed on
Oct 26, 2017
Sold by
Sweetser Kenneth L
Bought by
Sweetser Keeneth L
Current Estimated Value
Purchase Details
Closed on
Feb 8, 2005
Sold by
Molden Real Estate Corp
Bought by
Fuller Mark
Home Financials for this Owner
Home Financials are based on the most recent Mortgage that was taken out on this home.
Original Mortgage
$150,100
Outstanding Balance
$76,695
Interest Rate
5.83%
Mortgage Type
New Conventional
Estimated Equity
$386,653
Create a Home Valuation Report for This Property
The Home Valuation Report is an in-depth analysis detailing your home's value as well as a comparison with similar homes in the area
Home Values in the Area
Average Home Value in this Area
Purchase History
| Date | Buyer | Sale Price | Title Company |
|---|---|---|---|
| Sweetser Keeneth L | -- | None Available | |
| Fuller Mark | $126,000 | -- |
Source: Public Records
Mortgage History
| Date | Status | Borrower | Loan Amount |
|---|---|---|---|
| Open | Fuller Mark | $150,100 |
Source: Public Records
Tax History
| Year | Tax Paid | Tax Assessment Tax Assessment Total Assessment is a certain percentage of the fair market value that is determined by local assessors to be the total taxable value of land and additions on the property. | Land | Improvement |
|---|---|---|---|---|
| 2025 | $1,880 | $391,648 | $83,000 | $308,648 |
| 2024 | $853 | $334,700 | $67,000 | $267,700 |
| 2023 | $1,707 | $334,700 | $67,000 | $267,700 |
| 2022 | $1,699 | $278,600 | $62,000 | $216,600 |
| 2021 | $1,699 | $278,600 | $62,000 | $216,600 |
| 2020 | $1,629 | $267,000 | $62,000 | $205,000 |
| 2019 | $1,629 | $267,000 | $62,000 | $205,000 |
| 2018 | $1,469 | $240,800 | $62,000 | $178,800 |
| 2017 | $1,445 | $240,800 | $62,000 | $178,800 |
| 2016 | $1,330 | $221,600 | $49,500 | $172,100 |
| 2015 | $1,241 | $221,600 | $49,500 | $172,100 |
| 2014 | $625 | $209,900 | $49,500 | $160,400 |
Source: Public Records
Map
Nearby Homes
Your Personal Tour Guide
Ask me questions while you tour the home.