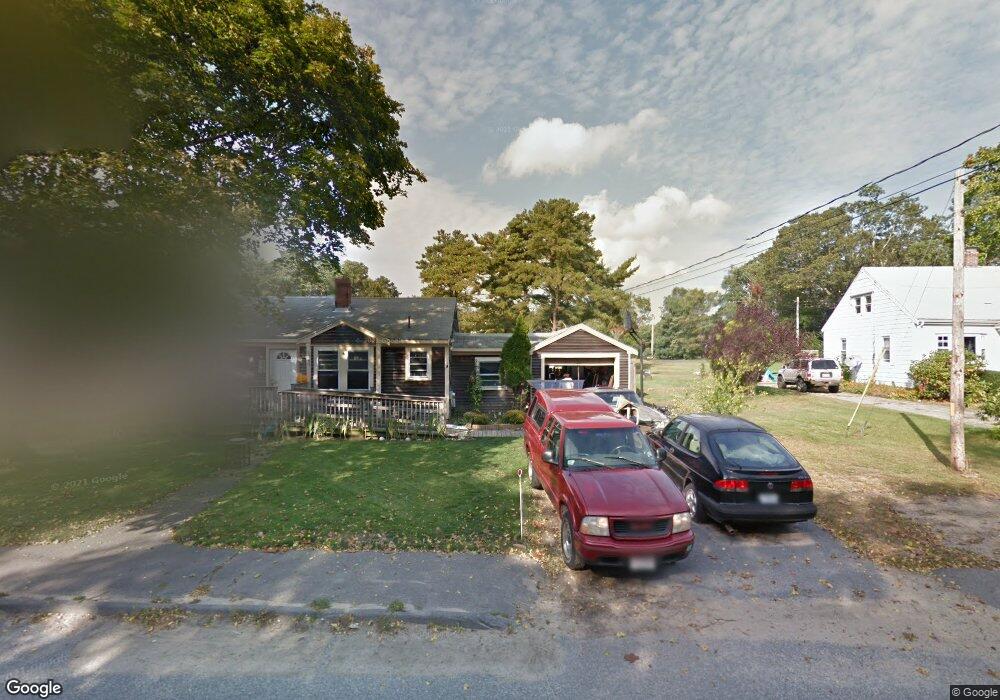
1063 Main St West Wareham, MA 02576
West Wareham AreaEstimated Value: $425,000 - $462,000
2
Beds
1
Bath
1,108
Sq Ft
$396/Sq Ft
Est. Value
About This Home
This home is located at 1063 Main St, West Wareham, MA 02576 and is currently estimated at $438,696, approximately $395 per square foot. 1063 Main St is a home.
Create a Home Valuation Report for This Property
The Home Valuation Report is an in-depth analysis detailing your home's value as well as a comparison with similar homes in the area
Home Values in the Area
Average Home Value in this Area
Tax History
We collect this data history from publicly available records. To have your information removed, we recommend requesting removal directly through your county’s website.
| Year | Tax Paid | Tax Assessment Tax Assessment Total Assessment is a certain percentage of the fair market value that is determined by local assessors to be the total taxable value of land and additions on the property. | Land | Improvement |
|---|---|---|---|---|
| 2025 | $3,624 | $347,800 | $133,000 | $214,800 |
| 2024 | $3,648 | $324,800 | $106,600 | $218,200 |
| 2023 | $3,471 | $288,500 | $97,100 | $191,400 |
| 2022 | $3,263 | $247,600 | $97,100 | $150,500 |
| 2021 | $3,233 | $240,400 | $97,100 | $143,300 |
| 2020 | $3,092 | $233,200 | $97,100 | $136,100 |
| 2019 | $3,128 | $235,400 | $100,400 | $135,000 |
| 2018 | $2,937 | $215,500 | $100,400 | $115,100 |
| 2017 | $2,831 | $210,500 | $100,400 | $110,100 |
| 2016 | $2,776 | $205,200 | $102,600 | $102,600 |
| 2015 | $2,682 | $205,200 | $102,600 | $102,600 |
| 2014 | $2,665 | $207,400 | $102,600 | $104,800 |
Source: Public Records
Map
Nearby Homes
- 12 King Dr
- 51 Crest Dr
- 2230 Cranberry Hwy Unit A
- 2232 Cranberry Hwy Unit B
- 8 Naushon Rd
- 21 Papermill Rd
- 60 Papermill Rd
- 70 Papermill Rd Unit 70
- 5 Timber Ln
- 18 Bethel Way
- 351 County Rd
- 191 Pineviewter Unit 191
- 193 Pine View Terrace
- 140 Jupiter Cir
- 189 Pine View Terrace
- 157 Windswept Rd
- 842 Main St
- 806 Main St
- 17 Forbes Rd
- 148 County Rd
Your Personal Tour Guide
Ask me questions while you tour the home.