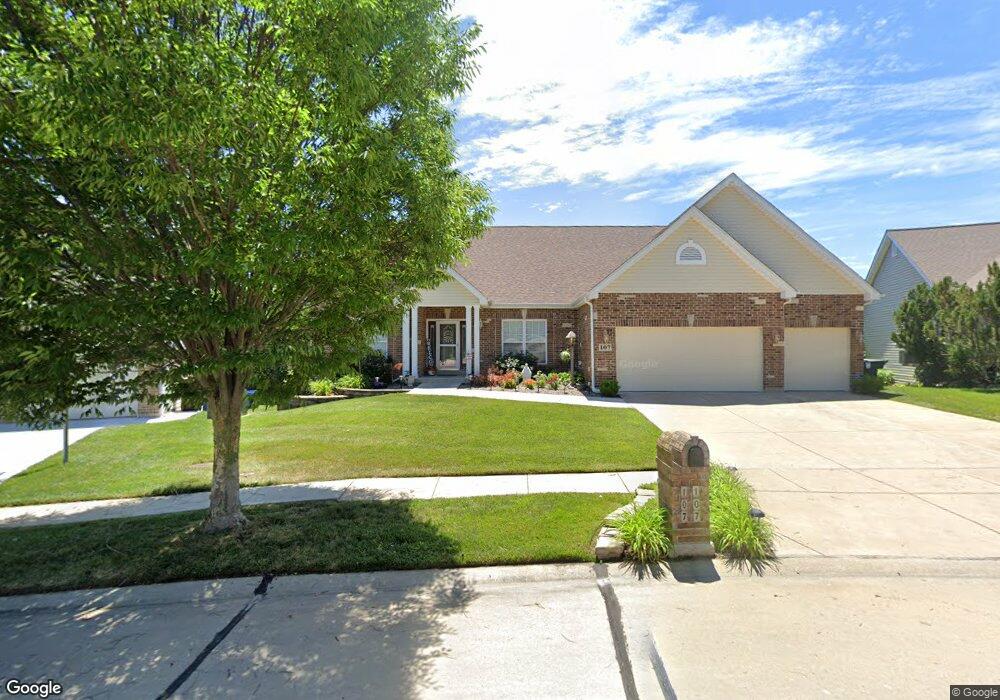
107 Vantage Pointe Dr Saint Peters, MO 63376
Estimated Value: $555,000 - $626,000
3
Beds
4
Baths
2,854
Sq Ft
$204/Sq Ft
Est. Value
About This Home
This home is located at 107 Vantage Pointe Dr, Saint Peters, MO 63376 and is currently estimated at $582,599, approximately $204 per square foot. 107 Vantage Pointe Dr is a home located in St. Charles County with nearby schools including Dr. Bernard J. Dubray Middle School, Fort Zumwalt East High School, and Lutheran High School Of St Charles County.
Ownership History
Date
Name
Owned For
Owner Type
Purchase Details
Closed on
Oct 10, 2012
Sold by
U S Bank National Association
Bought by
Wildberger Jeffrey T
Current Estimated Value
Home Financials for this Owner
Home Financials are based on the most recent Mortgage that was taken out on this home.
Original Mortgage
$232,769
Outstanding Balance
$161,489
Interest Rate
3.55%
Mortgage Type
New Conventional
Estimated Equity
$421,110
Purchase Details
Closed on
Jan 12, 2011
Sold by
Mckay Barbara D and Mckay Barbara Diane
Bought by
U S Bank National Association
Purchase Details
Closed on
Dec 11, 2003
Sold by
Vantage Homes Inc
Bought by
Mckay Barbara D
Home Financials for this Owner
Home Financials are based on the most recent Mortgage that was taken out on this home.
Original Mortgage
$266,104
Interest Rate
6.75%
Mortgage Type
Purchase Money Mortgage
Create a Home Valuation Report for This Property
The Home Valuation Report is an in-depth analysis detailing your home's value as well as a comparison with similar homes in the area
Home Values in the Area
Average Home Value in this Area
Purchase History
| Date | Buyer | Sale Price | Title Company |
|---|---|---|---|
| Wildberger Jeffrey T | $245,020 | Continental Title Company | |
| U S Bank National Association | $240,000 | None Available | |
| Mckay Barbara D | -- | Capital Title |
Source: Public Records
Mortgage History
| Date | Status | Borrower | Loan Amount |
|---|---|---|---|
| Open | Wildberger Jeffrey T | $232,769 | |
| Previous Owner | Mckay Barbara D | $266,104 |
Source: Public Records
Tax History
| Year | Tax Paid | Tax Assessment Tax Assessment Total Assessment is a certain percentage of the fair market value that is determined by local assessors to be the total taxable value of land and additions on the property. | Land | Improvement |
|---|---|---|---|---|
| 2025 | $6,831 | $114,921 | -- | -- |
| 2023 | $6,825 | $96,245 | $0 | $0 |
| 2022 | $6,222 | $82,226 | $0 | $0 |
| 2021 | $6,213 | $82,226 | $0 | $0 |
| 2020 | $5,966 | $76,542 | $0 | $0 |
| 2019 | $5,952 | $76,542 | $0 | $0 |
| 2018 | $5,478 | $67,689 | $0 | $0 |
| 2017 | $5,453 | $67,689 | $0 | $0 |
| 2016 | $5,045 | $62,495 | $0 | $0 |
| 2015 | $4,721 | $62,495 | $0 | $0 |
| 2014 | $4,450 | $57,732 | $0 | $0 |
Source: Public Records
Map
Nearby Homes
- 431 Scenic Dr
- 1210 Emerald Gardens Dr
- 56 Fountain Valley Ct
- 57 Aspen Ridge Ct
- 25 Aspen Ridge Ct
- 223 Bordeaux Way
- 633 Bordeaux Way
- 532 Bordeaux Way
- 1705 Misty Manor Ct
- 1844 Sterling Oaks Dr
- 31 Brinnington Dr
- 1802 Sterling Oaks Dr
- 0 the Indigo@weiss Rd
- 122 Lily Pad Ln
- New Build Forest H at Weiss Rd
- 47 Savannah Hill Dr
- 0 Unknown Unit MIS25071652
- 11 Denallen Dr
- 8 Westglen Ct
- 317 Lake Side View Ln
- 109 Vantage Pointe Dr
- 105 Vantage Pointe Dr
- 402 Scenic Dr
- 404 Scenic Dr
- 111 Vantage Pointe Dr
- 300 Outlook Ct
- 103 Vantage Pointe Dr
- 406 Scenic Dr
- 301 Outlook Ct
- 400 Scenic Dr
- 113 Vantage Pointe Dr
- 101 Vantage Pointe Dr
- 408 Scenic Dr
- 302 Outlook Ct
- 303 Outlook Ct
- 201 Vista Pointe Ct
- 403 Scenic Dr
- 115 Vantage Pointe Dr
- 401 Scenic Dr
- 304 Outlook Ct
Your Personal Tour Guide
Ask me questions while you tour the home.