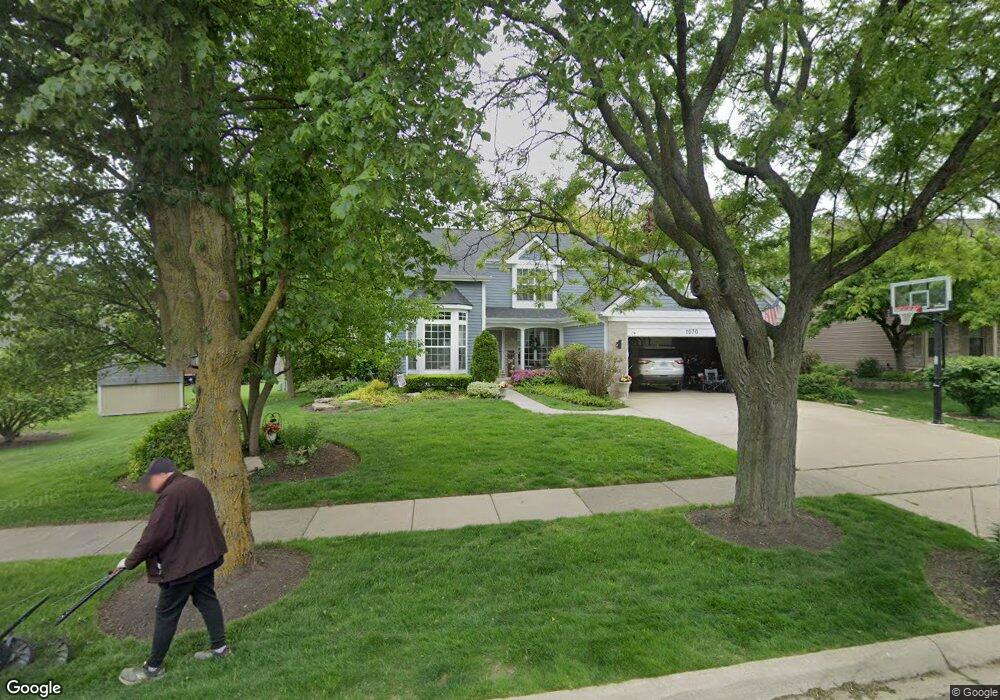
1070 Regency Ln Carol Stream, IL 60188
Estimated Value: $493,000 - $569,000
3
Beds
3
Baths
2,220
Sq Ft
$234/Sq Ft
Est. Value
About This Home
This home is located at 1070 Regency Ln, Carol Stream, IL 60188 and is currently estimated at $518,588, approximately $233 per square foot. 1070 Regency Ln is a home located in DuPage County with nearby schools including Heritage Lakes Elementary School, Jay Stream Middle School, and Glenbard North High School.
Ownership History
Date
Name
Owned For
Owner Type
Purchase Details
Closed on
Nov 21, 2017
Sold by
Martino Daniel I and Martino Brenda L
Bought by
Chicago Title Land Trust Company and Trust Number 8002376484
Current Estimated Value
Purchase Details
Closed on
Jun 13, 1997
Sold by
Schreiner Eric and Schreiner Patricia
Bought by
Martino Daniel T and Martino Brenda L
Home Financials for this Owner
Home Financials are based on the most recent Mortgage that was taken out on this home.
Original Mortgage
$213,000
Interest Rate
7.37%
Create a Home Valuation Report for This Property
The Home Valuation Report is an in-depth analysis detailing your home's value as well as a comparison with similar homes in the area
Home Values in the Area
Average Home Value in this Area
Purchase History
We collect this data history from publicly available records. To have your information removed, we recommend requesting removal directly through your county’s website.
| Date | Buyer | Sale Price | Title Company |
|---|---|---|---|
| Chicago Title Land Trust Company | -- | Chicago Title Land Trust Com | |
| Martino Daniel T | $224,500 | Attorneys Title Guaranty Fun |
Source: Public Records
Mortgage History
We collect this data history from publicly available records. To have your information removed, we recommend requesting removal directly through your county’s website.
| Date | Status | Borrower | Loan Amount |
|---|---|---|---|
| Previous Owner | Martino Daniel T | $213,000 |
Source: Public Records
Tax History
| Year | Tax Paid | Tax Assessment Tax Assessment Total Assessment is a certain percentage of the fair market value that is determined by local assessors to be the total taxable value of land and additions on the property. | Land | Improvement |
|---|---|---|---|---|
| 2024 | $10,726 | $141,060 | $38,522 | $102,538 |
| 2023 | $10,010 | $127,980 | $34,950 | $93,030 |
| 2022 | $9,959 | $118,940 | $32,480 | $86,460 |
| 2021 | $9,468 | $112,910 | $30,830 | $82,080 |
| 2020 | $9,251 | $109,530 | $29,910 | $79,620 |
| 2019 | $8,894 | $105,620 | $28,840 | $76,780 |
| 2018 | $9,309 | $106,390 | $29,050 | $77,340 |
| 2017 | $9,693 | $108,050 | $29,050 | $79,000 |
| 2016 | $9,519 | $103,210 | $27,750 | $75,460 |
| 2015 | $9,454 | $97,700 | $26,270 | $71,430 |
| 2014 | $9,008 | $91,900 | $25,600 | $66,300 |
| 2013 | $8,953 | $94,100 | $26,210 | $67,890 |
Source: Public Records
Map
Nearby Homes
- 892 Somerset Dr
- 873 Hampton Dr
- 605 Kingsbridge Dr Unit 10D
- 1192 Scott Ct
- 1194 Scott Ct Unit 6C
- 1475 Merrimac Ln N
- 1390 Merrimac Ln N
- 427 W Army Trail Rd
- 429 W Army Trail Rd
- 415 W Army Trail Rd
- 421 Burke Dr
- 1334 Coldspring Rd Unit 203
- 1008 Rockport Dr Unit 213
- 376 Canyon Trail
- 3895 Clipper Dr
- 793 Santa fe Ct
- 1085 Rockport Dr Unit 57
- 1343 Seabury Cir Unit 1
- 2068 Leeward Ln
- 1188 Brookstone Dr
- 1076 Regency Ln
- 1068 Buckingham Dr
- 1074 Buckingham Dr
- 1071 Brighton Dr Unit DT
- 1084 Regency Ln
- 1075 Brighton Dr
- 1061 Brighton Dr
- 1081 Brighton Dr
- 1073 Regency Ln
- 1083 Regency Ln
- 1065 Regency Ln
- 1090 Regency Ln Unit 5
- 1085 Brighton Dr
- 1061 Regency Ln
- 1091 Regency Ln
- 1065 Buckingham Dr
- 1089 Brighton Dr
- 1073 Buckingham Dr
- 1098 Regency Ln
- 732 Mayfair Dr
Your Personal Tour Guide
Ask me questions while you tour the home.