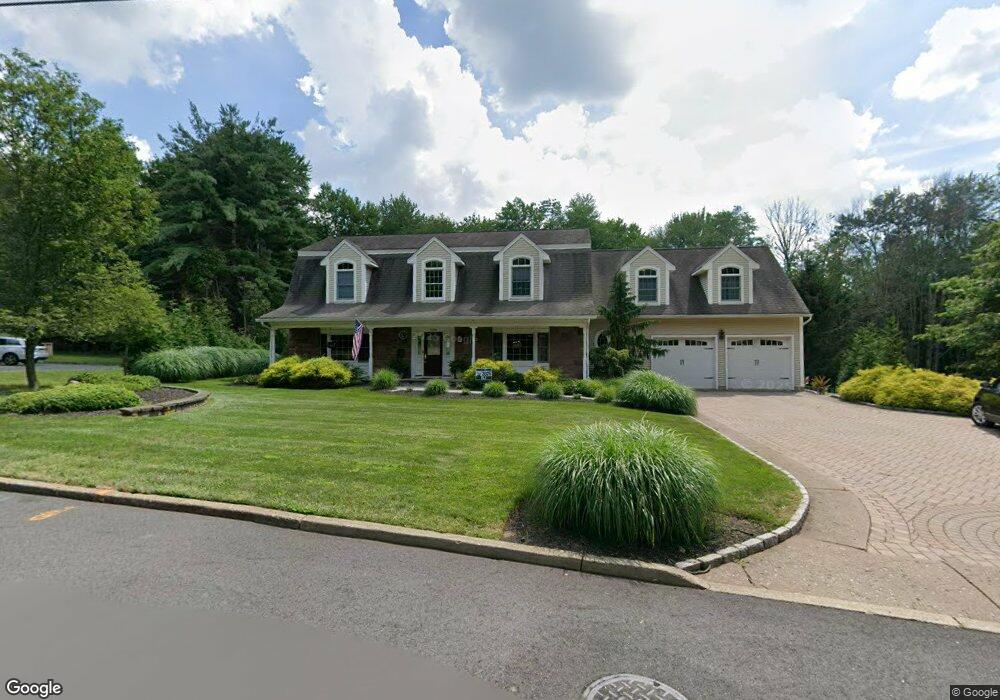
108 Elbrook Dr Allendale, NJ 07401
Estimated Value: $1,555,000 - $1,999,000
Studio
--
Bath
3,941
Sq Ft
$449/Sq Ft
Est. Value
About This Home
This home is located at 108 Elbrook Dr, Allendale, NJ 07401 and is currently estimated at $1,768,119, approximately $448 per square foot. 108 Elbrook Dr is a home located in Bergen County with nearby schools including Hillside Elementary School, Brookside Elementary School, and Northern Highlands Reg High School.
Ownership History
Date
Name
Owned For
Owner Type
Purchase Details
Closed on
Jul 22, 2015
Sold by
Mcentee April A and Mc Entee William J
Bought by
Maloof Ryan E and Maloof Amy L
Current Estimated Value
Home Financials for this Owner
Home Financials are based on the most recent Mortgage that was taken out on this home.
Original Mortgage
$862,500
Outstanding Balance
$660,799
Interest Rate
3.37%
Mortgage Type
New Conventional
Estimated Equity
$1,107,320
Purchase Details
Closed on
Sep 17, 2008
Sold by
Mcentee William J and Mcentee April A
Bought by
Mcentee April A and Mcentee William J
Purchase Details
Closed on
Jun 25, 1993
Sold by
Fischer Eugene and Fischer Mary
Bought by
Mcentee William Jr and Mcentee April
Create a Home Valuation Report for This Property
The Home Valuation Report is an in-depth analysis detailing your home's value as well as a comparison with similar homes in the area
Home Values in the Area
Average Home Value in this Area
Purchase History
We collect this data history from publicly available records. To have your information removed, we recommend requesting removal directly through your county’s website.
| Date | Buyer | Sale Price | Title Company |
|---|---|---|---|
| Maloof Ryan E | $1,150,000 | Chicago Title | |
| Mcentee April A | -- | -- | |
| Mcentee William Jr | $317,000 | -- |
Source: Public Records
Mortgage History
We collect this data history from publicly available records. To have your information removed, we recommend requesting removal directly through your county’s website.
| Date | Status | Borrower | Loan Amount |
|---|---|---|---|
| Open | Maloof Ryan E | $862,500 |
Source: Public Records
Tax History
| Year | Tax Paid | Tax Assessment Tax Assessment Total Assessment is a certain percentage of the fair market value that is determined by local assessors to be the total taxable value of land and additions on the property. | Land | Improvement |
|---|---|---|---|---|
| 2025 | $25,620 | $1,309,800 | $448,800 | $861,000 |
| 2024 | $26,324 | $1,214,800 | $401,300 | $813,500 |
| 2023 | $25,926 | $1,197,100 | $393,800 | $803,300 |
| 2022 | $25,926 | $1,138,600 | $373,800 | $764,800 |
| 2021 | $24,763 | $1,054,200 | $325,400 | $728,800 |
| 2020 | $25,199 | $1,044,300 | $320,400 | $723,900 |
| 2019 | $24,432 | $1,040,100 | $320,400 | $719,700 |
| 2018 | $23,891 | $1,040,100 | $320,400 | $719,700 |
| 2017 | $23,797 | $1,040,100 | $320,400 | $719,700 |
| 2016 | $23,829 | $1,040,100 | $320,400 | $719,700 |
| 2015 | $22,859 | $1,018,200 | $320,400 | $697,800 |
| 2014 | $22,963 | $963,600 | $320,400 | $643,200 |
Source: Public Records
Map
Nearby Homes
- 24 Vanderbeck Ln
- 15 Old Oak Dr
- 4 Conklin Ct
- 232 Momar Dr
- 17 Appert Terrace
- 62 Martis Ave
- 5 Sycamore Ct
- 56 Longfellow Ln
- 173 Myrtle Ave
- 7 Goose Cove Ln
- 41 Ramsey Ave
- 113 Macleish Ct
- 314 Canterbury Dr
- 77 Myrtle Ave
- 112 Edgewood Rd
- 132 Maple St
- 255 Park Ave
- 218 Orchard Park
- 107 Maple St
- 314 Meadowbrook Rd
Your Personal Tour Guide
Ask me questions while you tour the home.