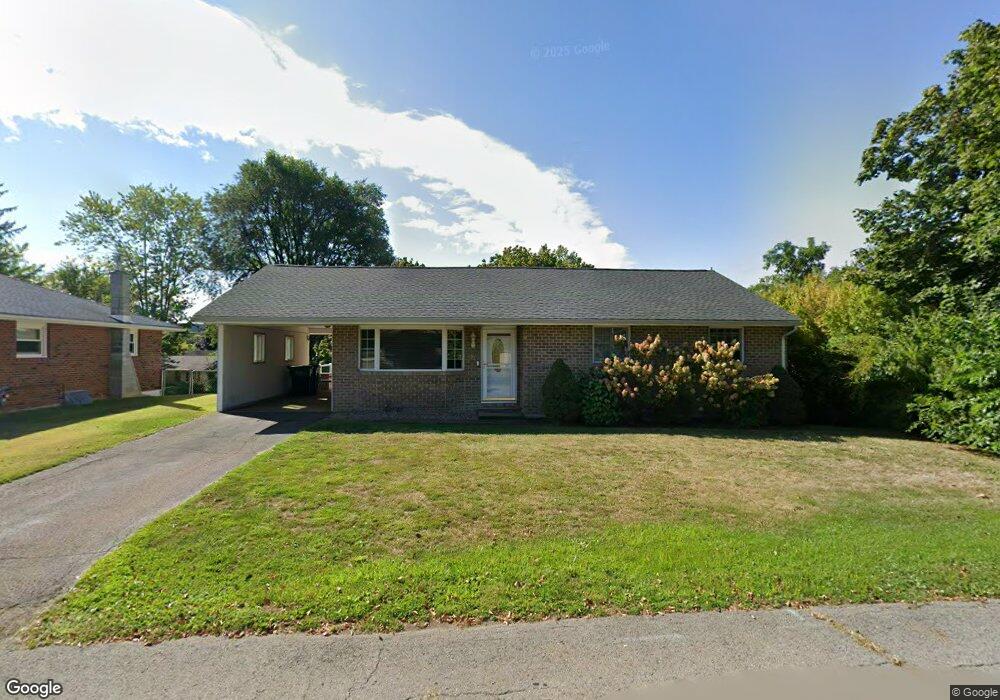
108 Maple St Danville, PA 17821
Estimated Value: $283,529 - $322,000
3
Beds
2
Baths
1,142
Sq Ft
$260/Sq Ft
Est. Value
About This Home
This home is located at 108 Maple St, Danville, PA 17821 and is currently estimated at $297,132, approximately $260 per square foot. 108 Maple St is a home located in Montour County with nearby schools including Danville Primary School, Liberty-Valley Elementary School, and Danville Area Middle School.
Ownership History
Date
Name
Owned For
Owner Type
Purchase Details
Closed on
Oct 23, 2025
Sold by
Koenig Sean W
Bought by
Brady Kevin T and Brady Kristina M
Current Estimated Value
Home Financials for this Owner
Home Financials are based on the most recent Mortgage that was taken out on this home.
Original Mortgage
$45,000
Outstanding Balance
$44,788
Interest Rate
6.34%
Mortgage Type
New Conventional
Estimated Equity
$252,344
Purchase Details
Closed on
Sep 16, 2022
Sold by
Willard Evan A and Willard Blair L
Bought by
Koenig Sean W
Home Financials for this Owner
Home Financials are based on the most recent Mortgage that was taken out on this home.
Original Mortgage
$213,750
Interest Rate
4.99%
Mortgage Type
New Conventional
Create a Home Valuation Report for This Property
The Home Valuation Report is an in-depth analysis detailing your home's value as well as a comparison with similar homes in the area
Home Values in the Area
Average Home Value in this Area
Purchase History
We collect this data history from publicly available records. To have your information removed, we recommend requesting removal directly through your county’s website.
| Date | Buyer | Sale Price | Title Company |
|---|---|---|---|
| Brady Kevin T | $305,000 | Hometown Abstract | |
| Koenig Sean W | $225,000 | -- |
Source: Public Records
Mortgage History
We collect this data history from publicly available records. To have your information removed, we recommend requesting removal directly through your county’s website.
| Date | Status | Borrower | Loan Amount |
|---|---|---|---|
| Open | Brady Kevin T | $45,000 | |
| Previous Owner | Koenig Sean W | $213,750 |
Source: Public Records
Tax History
| Year | Tax Paid | Tax Assessment Tax Assessment Total Assessment is a certain percentage of the fair market value that is determined by local assessors to be the total taxable value of land and additions on the property. | Land | Improvement |
|---|---|---|---|---|
| 2026 | $1,979 | $99,500 | $28,100 | $71,400 |
| 2025 | $1,828 | $99,500 | $28,100 | $71,400 |
| 2024 | $1,770 | $99,500 | $28,100 | $71,400 |
| 2023 | $1,770 | $99,500 | $28,100 | $71,400 |
| 2022 | $1,683 | $97,300 | $28,100 | $69,200 |
| 2021 | $1,645 | $97,300 | $28,100 | $69,200 |
| 2020 | $1,632 | $97,300 | $28,100 | $69,200 |
| 2019 | $1,584 | $97,300 | $28,100 | $69,200 |
| 2018 | $1,547 | $97,300 | $28,100 | $69,200 |
| 2017 | $587 | $97,300 | $28,100 | $69,200 |
| 2016 | $1,541 | $97,300 | $28,100 | $69,200 |
| 2015 | $587 | $97,300 | $28,100 | $69,200 |
| 2014 | -- | $97,300 | $28,100 | $69,200 |
Source: Public Records
Map
Nearby Homes
Your Personal Tour Guide
Ask me questions while you tour the home.