108 Margin St Salem, MA 01970
Downtown Salem NeighborhoodEstimated Value: $865,305 - $1,044,000
About This Home
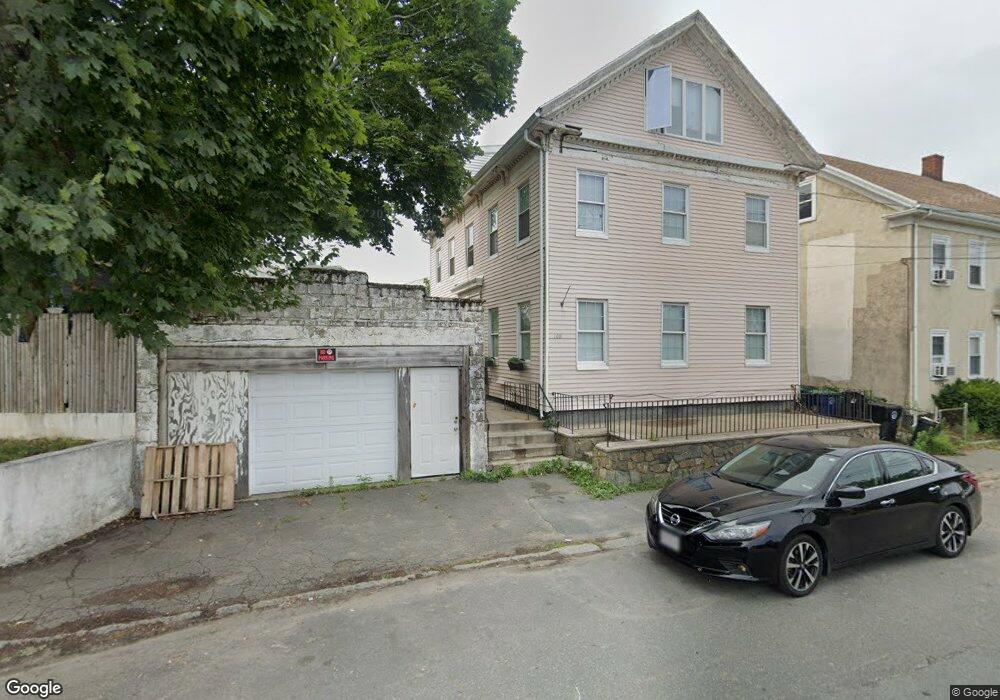
This home is located at 108 Margin St, Salem, MA 01970 and is currently estimated at $975,076, approximately $277 per square foot. 108 Margin St is a home located in Essex County with nearby schools including Saltonstall School, Horace Mann Laboratory, and Carlton Elementary School.
Ownership History
We collect this data history from publicly available records. To have your information removed, we recommend requesting removal directly through your county’s website.
Purchase Details
Home Financials for this Owner
Home Financials are based on the most recent Mortgage that was taken out on this home.Home Values in the Area
Average Home Value in this Area
Purchase History
We collect this data history from publicly available records. To have your information removed, we recommend requesting removal directly through your county’s website.
| Date | Buyer | Sale Price | Title Company |
|---|---|---|---|
| $40,000 | -- | ||
| $40,000 | -- | ||
| $120,000 | -- |
Mortgage History
We collect this data history from publicly available records. To have your information removed, we recommend requesting removal directly through your county’s website.
| Date | Status | Borrower | Loan Amount |
|---|---|---|---|
| Open | $210,500 | ||
| Closed | $211,500 | ||
| Previous Owner | $32,000 |
Tax History
We collect this data history from publicly available records. To have your information removed, we recommend requesting removal directly through your county’s website.
| Year | Tax Paid | Tax Assessment Tax Assessment Total Assessment is a certain percentage of the fair market value that is determined by local assessors to be the total taxable value of land and additions on the property. | Land | Improvement |
|---|---|---|---|---|
| 2025 | $8,930 | $787,500 | $151,900 | $635,600 |
| 2024 | $8,243 | $709,400 | $151,900 | $557,500 |
| 2023 | $7,966 | $636,800 | $134,000 | $502,800 |
| 2022 | $7,896 | $595,900 | $125,100 | $470,800 |
| 2021 | $7,449 | $539,800 | $116,700 | $423,100 |
| 2020 | $7,356 | $509,100 | $120,900 | $388,200 |
| 2019 | $7,206 | $477,200 | $110,200 | $367,000 |
| 2018 | $6,457 | $419,800 | $95,300 | $324,500 |
| 2017 | $6,019 | $379,500 | $76,200 | $303,300 |
| 2016 | $5,947 | $379,500 | $76,200 | $303,300 |
| 2015 | $5,527 | $336,800 | $65,500 | $271,300 |
Map
- 114 Margin St Unit 2
- 75 Summer St Unit 5
- 59 Summer St
- 8-10 & 5 Porter St Ct & Ropes Portfolio
- 184 Lafayette St
- 9 Phelps St
- 185 Lafayette St Unit 3
- 15 1/2 Palmer St
- 19 Palmer St
- 23 Summer St Unit 3
- 23 Summer St Unit 9
- 23 Summer St Unit 2
- 23 Summer St Unit 10
- 23 Summer St Unit 8
- 33 Harbor St
- 3 Chase St
- 16 Leavitt St Unit 2
- 16 Leavitt St Unit 3
- 141 Washington St Unit 3
- 41 Harbor St Unit 4
- 106 Margin St
- 106 Margin St Unit 1
- 112 Margin St
- 112 Margin St Unit 1
- 112 Margin St Unit 2
- 85 Summer St
- 5 Prescott St
- 98 Margin St Unit 2L
- 98 Margin St
- 7 Prescott St
- 114 Margin St
- 114 Margin St Unit 1
- 83 1/2 Summer St
- 83 Summer St
- 83 Summer St Unit 2
- 83 1/2 Summer St Unit 2
- 83 1/2 Summer St Unit 1
- 96 Margin St
- 96 Margin St
- 96 Margin St Unit 2
Ask me questions while you tour the home.