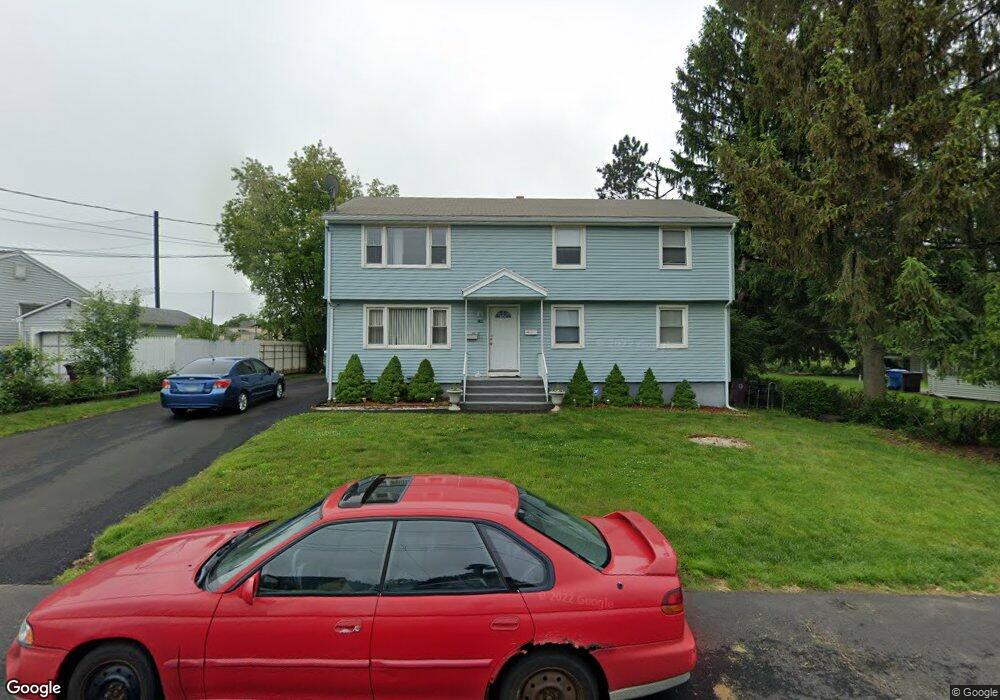
108 Neanda St New Britain, CT 06053
Estimated Value: $336,495 - $429,000
About This Home
This home is located at 108 Neanda St, New Britain, CT 06053 and is currently estimated at $399,624, approximately $179 per square foot. 108 Neanda St is a home located in Hartford County with nearby schools including Jefferson School, Pulaski Middle School, and Mountain Laurel Sudbury School.
Ownership History
We collect this data history from publicly available records. To have your information removed, we recommend requesting removal directly through your county’s website.
Purchase Details
Home Financials for this Owner
Home Financials are based on the most recent Mortgage that was taken out on this home.Purchase Details
Home Financials for this Owner
Home Financials are based on the most recent Mortgage that was taken out on this home.Home Values in the Area
Average Home Value in this Area
Purchase History
We collect this data history from publicly available records. To have your information removed, we recommend requesting removal directly through your county’s website.
| Date | Buyer | Sale Price | Title Company |
|---|---|---|---|
| $223,000 | -- | ||
| $154,000 | -- |
Mortgage History
We collect this data history from publicly available records. To have your information removed, we recommend requesting removal directly through your county’s website.
| Date | Status | Borrower | Loan Amount |
|---|---|---|---|
| Open | $167,250 | ||
| Closed | $55,750 | ||
| Previous Owner | $151,620 | ||
| Previous Owner | $25,000 |
Tax History
We collect this data history from publicly available records. To have your information removed, we recommend requesting removal directly through your county’s website.
| Year | Tax Paid | Tax Assessment Tax Assessment Total Assessment is a certain percentage of the fair market value that is determined by local assessors to be the total taxable value of land and additions on the property. | Land | Improvement |
|---|---|---|---|---|
| 2025 | $6,541 | $166,950 | $44,030 | $122,920 |
| 2024 | $6,610 | $166,950 | $44,030 | $122,920 |
| 2023 | $6,391 | $166,950 | $44,030 | $122,920 |
| 2022 | $5,499 | $111,090 | $18,550 | $92,540 |
| 2021 | $5,499 | $111,090 | $18,550 | $92,540 |
| 2020 | $5,610 | $111,090 | $18,550 | $92,540 |
| 2019 | $5,610 | $111,090 | $18,550 | $92,540 |
| 2018 | $5,610 | $111,090 | $18,550 | $92,540 |
| 2017 | $5,868 | $116,200 | $18,550 | $97,650 |
| 2016 | $5,868 | $116,200 | $18,550 | $97,650 |
| 2015 | $5,694 | $116,200 | $18,550 | $97,650 |
| 2014 | $5,694 | $116,200 | $18,550 | $97,650 |
Map
- 132 Neanda St
- 2041 Corbin Ave
- 134 Golden Hill St
- 383 Osgood Ave
- 822 Slater Rd
- 1812 Corbin Ave
- 201 Pierremount Ave Unit D
- 43 Westover Rd
- 410 Farmington Ave Unit G6
- 40 Royal Oak Rd
- 21 Skipper St
- 77 Osgood Ave
- 42 Helen Dr
- 73 Helen Dr
- 276 Farmington Ave
- 82 Carver St
- 485 High St Unit C
- 49 Allen St
- 25 Clinton St
- 55 Allen St
Ask me questions while you tour the home.