M
Seller's Agent in 2014
Marcia Hall
C21 Purdum-Epperson Inc


Estimated Value: $262,000 - $363,901
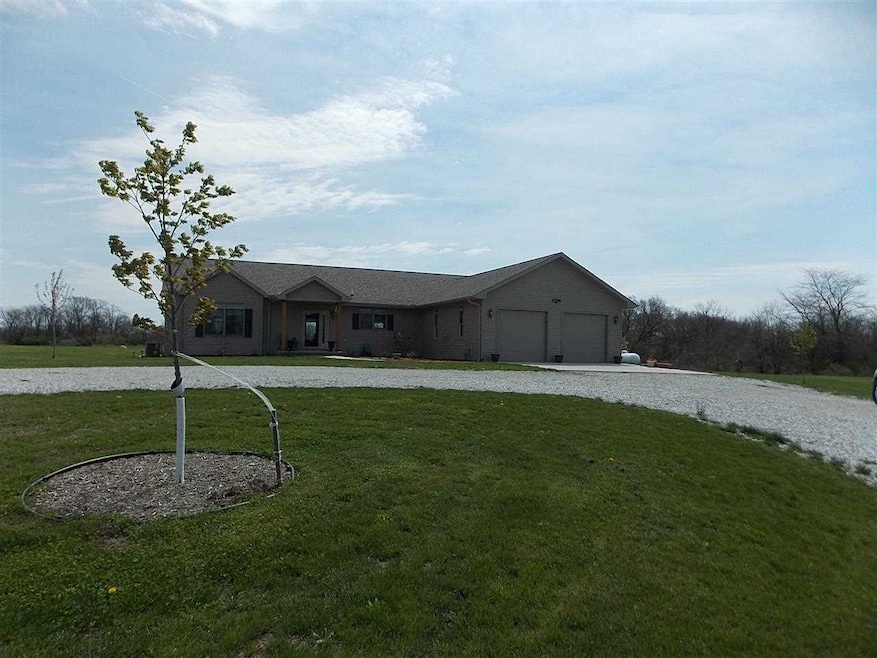
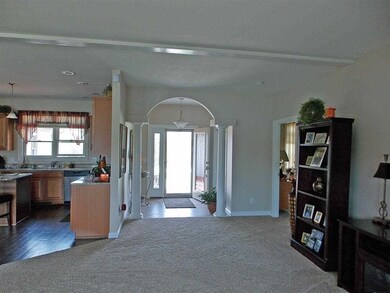
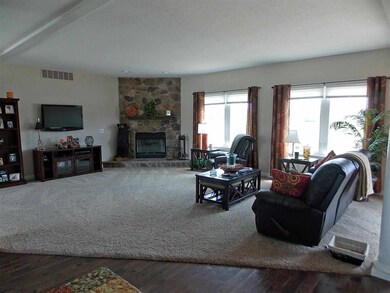
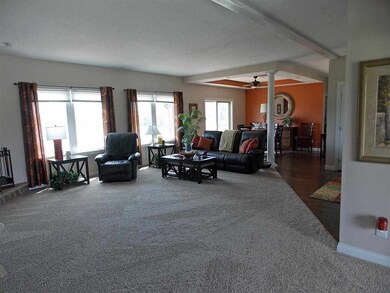
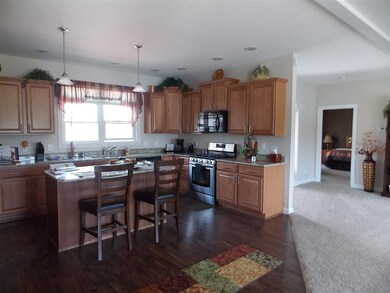
THIS HOME SITS ON APPROX. 3+ ACRES AND INCLUDES A 1.5 ACRE POND. ALSO AVAILABLE IS 42.3 ACRES+/- OF TIMBER ADJACENT TO THE SOUTH PRICED AT $3800/ACRE. HUGE MASTER BEDROOM AND BATH, 9' CEILINGS, HOOKED UP TO RURAL WATER, HARDWOOD FLOORING & PLUSH CARPET, STAINLESS STEEL APPLIANCES & GRANITE COUNTERTOPS.
Last Agent to Sell the Property
Marcia Hall
C21 Purdum-Epperson Inc License #475126819 Listed on: 05/01/2014
We collect this data history from publicly available records. To have your information removed, we recommend requesting removal directly through your county’s website.
We collect this data history from publicly available records. To have your information removed, we recommend requesting removal directly through your county’s website.
| Date | Buyer | Sale Price | Title Company |
|---|---|---|---|
| $290,000 | None Available |
We collect this data history from publicly available records. To have your information removed, we recommend requesting removal directly through your county’s website.
| Date | Status | Borrower | Loan Amount |
|---|---|---|---|
| Open | $270,000 |
We collect this data history from publicly available records. To have your information removed, we recommend requesting removal directly through your county’s website.
| Date | Event | Price | List to Sale | Price per Sq Ft |
|---|---|---|---|---|
| 08/07/2014 08/07/14 | Sold | $290,000 | -3.0% | $150 / Sq Ft |
| 06/04/2014 06/04/14 | Pending | -- | -- | -- |
| 05/01/2014 05/01/14 | For Sale | $299,000 | -- | $155 / Sq Ft |
We collect this data history from publicly available records. To have your information removed, we recommend requesting removal directly through your county’s website.
| Year | Tax Paid | Tax Assessment Tax Assessment Total Assessment is a certain percentage of the fair market value that is determined by local assessors to be the total taxable value of land and additions on the property. | Land | Improvement |
|---|---|---|---|---|
| 2024 | $8,531 | $88,283 | $8,521 | $79,762 |
| 2023 | $7,924 | $83,333 | $8,043 | $75,290 |
| 2022 | $8,702 | $94,258 | $7,622 | $86,636 |
| 2021 | $8,288 | $92,655 | $7,492 | $85,163 |
| 2020 | $8,120 | $98,453 | $7,365 | $91,088 |
| 2019 | $8,156 | $93,014 | $7,521 | $85,493 |
| 2018 | $8,079 | $95,624 | $7,732 | $87,892 |
| 2017 | $7,925 | $95,624 | $7,732 | $87,892 |
| 2016 | $7,593 | $93,749 | $7,580 | $86,169 |
| 2015 | $7,560 | $92,491 | $7,478 | $85,013 |
| 2014 | -- | $65,118 | $6,837 | $58,281 |
M
Seller's Agent in 2014
Marcia Hall
C21 Purdum-Epperson Inc

Buyer's Agent in 2014
Lorraine Epperson
C21 Purdum-Epperson Inc
(309) 833-4579
80 Total Sales
Source: RMLS Alliance
MLS Number: RMAPA1164966
APN: 04-000-126-10
Disclaimer: Certain information contained herein is derived from information provided by parties other than Homes.com. All information provided is deemed reliable, but is not guaranteed to be accurate and should be independently verified.
![]() All data is obtained from various sources and may not have been verified by broker or MLS GRID. Supplied Open House Information is subject to change without notice. All information should be independently reviewed and verified for accuracy. Properties may or may not be listed by the office/agent presenting the information. Some IDX listings have been excluded from this website.IDX information is provided exclusively for personal, non-commercial use, and may not be used for any purpose other than to identify prospective properties consumers may be interested in purchasing. Information is deemed reliable but not guaranteed.
All data is obtained from various sources and may not have been verified by broker or MLS GRID. Supplied Open House Information is subject to change without notice. All information should be independently reviewed and verified for accuracy. Properties may or may not be listed by the office/agent presenting the information. Some IDX listings have been excluded from this website.IDX information is provided exclusively for personal, non-commercial use, and may not be used for any purpose other than to identify prospective properties consumers may be interested in purchasing. Information is deemed reliable but not guaranteed.
Listings courtesy of RMLS Alliance as distributed by MLS GRID.
Based on information submitted to the MLS GRID
Ask me questions while you tour the home.