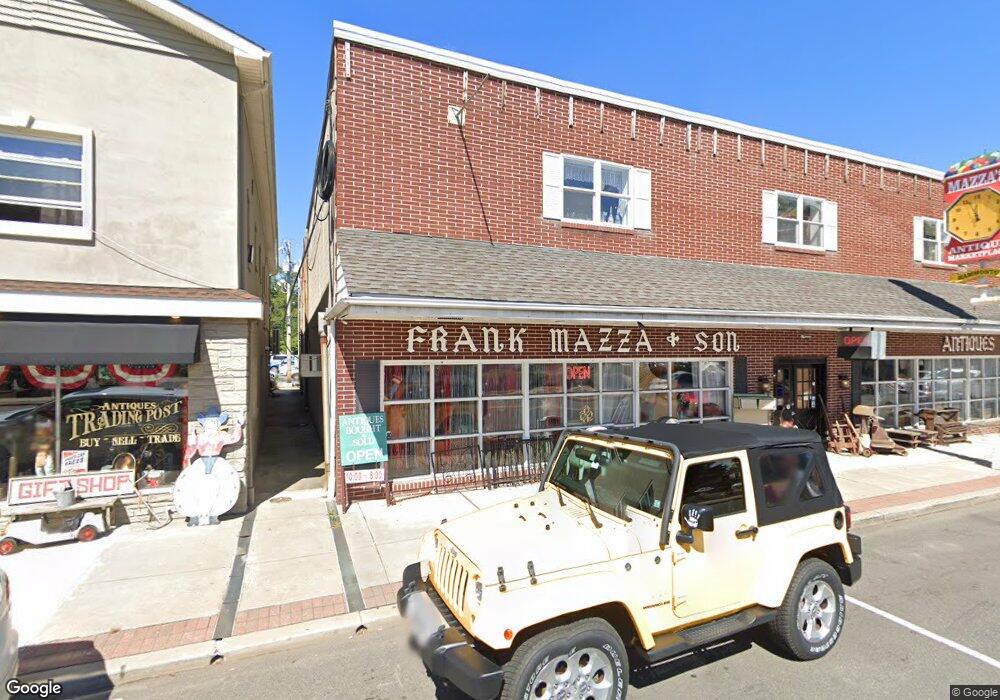
109 12th St Hammonton, NJ 08037
Estimated Value: $892,810
Studio
--
Bath
14,910
Sq Ft
$60/Sq Ft
Est. Value
About This Home
This home is located at 109 12th St, Hammonton, NJ 08037 and is currently estimated at $892,810, approximately $59 per square foot. 109 12th St is a home located in Atlantic County with nearby schools including Hammonton Early Childhood Education Center, Warren E. Sooy Jr. Elementary School, and Hammonton Middle School.
Ownership History
Date
Name
Owned For
Owner Type
Purchase Details
Closed on
Feb 11, 2013
Sold by
Mazza Frank
Bought by
109 12Th Street Llc
Current Estimated Value
Purchase Details
Closed on
Jun 17, 2011
Sold by
Elite Properties Llc
Bought by
Mazza Frank
Purchase Details
Closed on
Jan 1, 2005
Sold by
Mazza Carol
Bought by
Elite Properties Llc
Purchase Details
Closed on
Sep 4, 1998
Sold by
Mazza Carol Anne
Bought by
Mazza Carol and Mazza Frank
Purchase Details
Closed on
May 15, 1995
Sold by
Mazza Frank and Mazza Carol Anne
Bought by
Mazza Frank and Mazza Carol Anne
Create a Home Valuation Report for This Property
The Home Valuation Report is an in-depth analysis detailing your home's value as well as a comparison with similar homes in the area
Home Values in the Area
Average Home Value in this Area
Purchase History
| Date | Buyer | Sale Price | Title Company |
|---|---|---|---|
| 109 12Th Street Llc | -- | None Available | |
| Mazza Frank | -- | None Available | |
| Elite Properties Llc | $602,080 | -- | |
| Mazza Carol | -- | Sentry Land Title Agency Inc | |
| Mazza Frank | -- | -- |
Source: Public Records
Tax History
| Year | Tax Paid | Tax Assessment Tax Assessment Total Assessment is a certain percentage of the fair market value that is determined by local assessors to be the total taxable value of land and additions on the property. | Land | Improvement |
|---|---|---|---|---|
| 2025 | $13,067 | $474,800 | $226,800 | $248,000 |
| 2024 | $13,043 | $474,800 | $226,800 | $248,000 |
Source: Public Records
Map
Nearby Homes
- 112 Washington St N
- 116 Washington St N
- 120 Washington St N
- 113 W End Ave
- 118 Washington St N
- 119 W End Ave
- 121 W End Ave
- 123 W End Ave
- 125 W End Ave
- 127 W End Ave
- 40 Front St
- 131 N 2nd St
- 201 Grape St
- 228 Pleasant St E
- 212 Grape St
- 327 Pleasant St E
- 250 Rocco Dr
- 453 Bellevue Ave
- 34 N Packard St
- 26 N Packard St
Your Personal Tour Guide
Ask me questions while you tour the home.