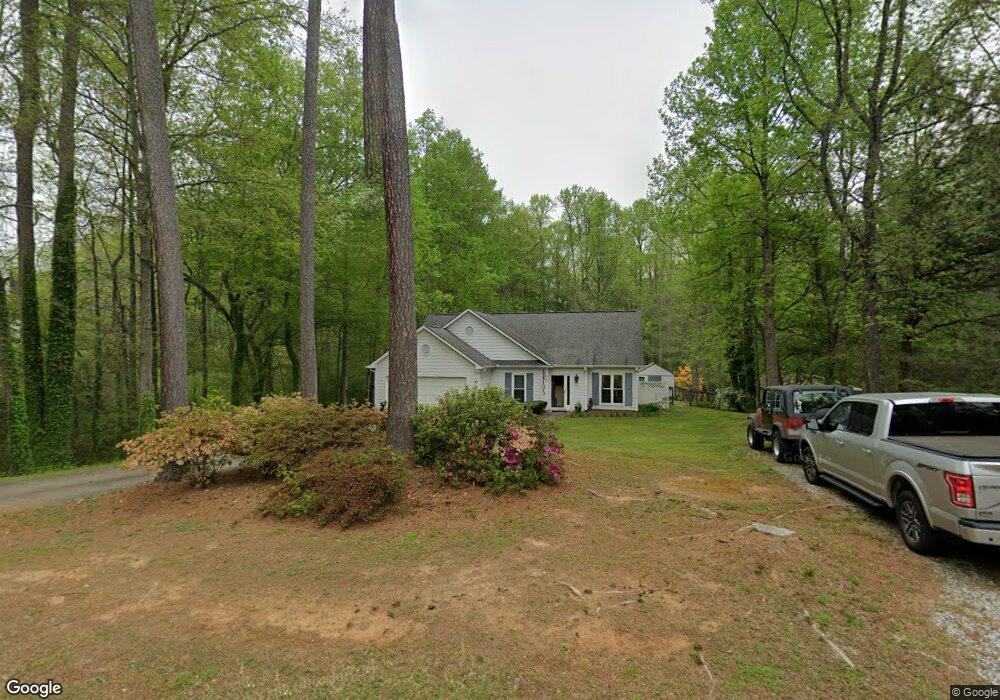
109 Blacks Mill Trace E Dawsonville, GA 30534
Estimated Value: $343,990 - $408,000
3
Beds
3
Baths
1,535
Sq Ft
$249/Sq Ft
Est. Value
About This Home
This home is located at 109 Blacks Mill Trace E, Dawsonville, GA 30534 and is currently estimated at $382,498, approximately $249 per square foot. 109 Blacks Mill Trace E is a home located in Dawson County with nearby schools including Black's Mill Elementary School, Dawson County Middle School, and Dawson County Junior High School.
Ownership History
Date
Name
Owned For
Owner Type
Purchase Details
Closed on
Feb 4, 2005
Sold by
Waters Brandon K
Bought by
Johnson William R and Johnson Teresa
Current Estimated Value
Home Financials for this Owner
Home Financials are based on the most recent Mortgage that was taken out on this home.
Original Mortgage
$135,959
Outstanding Balance
$66,972
Interest Rate
5.69%
Mortgage Type
FHA
Estimated Equity
$315,526
Purchase Details
Closed on
Jun 3, 2002
Sold by
Adams Darrell G
Bought by
Waters Brandon K and Hill Lisa A
Purchase Details
Closed on
Dec 10, 1992
Sold by
Adams Darrell G
Bought by
Adams Darrell G
Purchase Details
Closed on
Oct 16, 1991
Sold by
Phyllis Gravitt
Bought by
Adams Darrell G
Purchase Details
Closed on
May 17, 1990
Sold by
Holtzclaw Holtzclaw L and Holtzclaw Stan
Bought by
Holtzclaw Mary Ann
Purchase Details
Closed on
Dec 22, 1986
Sold by
Stanley Darnell
Bought by
Holtzclaw L T
Create a Home Valuation Report for This Property
The Home Valuation Report is an in-depth analysis detailing your home's value as well as a comparison with similar homes in the area
Home Values in the Area
Average Home Value in this Area
Purchase History
| Date | Buyer | Sale Price | Title Company |
|---|---|---|---|
| Johnson William R | $141,000 | -- | |
| Waters Brandon K | $128,000 | -- | |
| Adams Darrell G | -- | -- | |
| Adams Darrell G | $9,000 | -- | |
| Holtzclaw Mary Ann | -- | -- | |
| Holtzclaw L T | $120,000 | -- |
Source: Public Records
Mortgage History
| Date | Status | Borrower | Loan Amount |
|---|---|---|---|
| Open | Johnson William R | $135,959 |
Source: Public Records
Tax History
| Year | Tax Paid | Tax Assessment Tax Assessment Total Assessment is a certain percentage of the fair market value that is determined by local assessors to be the total taxable value of land and additions on the property. | Land | Improvement |
|---|---|---|---|---|
| 2025 | $1,968 | $125,780 | $12,000 | $113,780 |
| 2024 | $1,968 | $123,204 | $12,000 | $111,204 |
| 2023 | $1,971 | $124,884 | $12,000 | $112,884 |
| 2022 | $1,619 | $77,584 | $12,000 | $65,584 |
| 2021 | $1,443 | $65,784 | $12,000 | $53,784 |
| 2020 | $1,506 | $65,664 | $12,000 | $53,664 |
| 2019 | $1,316 | $57,144 | $12,000 | $45,144 |
| 2018 | $1,319 | $57,144 | $12,000 | $45,144 |
| 2017 | $1,180 | $51,345 | $12,000 | $39,345 |
| 2016 | $1,193 | $51,893 | $13,200 | $38,693 |
| 2015 | $1,054 | $44,699 | $13,200 | $31,499 |
| 2014 | $895 | $37,121 | $11,220 | $25,901 |
| 2013 | -- | $30,932 | $9,240 | $21,692 |
Source: Public Records
Map
Nearby Homes
- 180 Blacks Mill Trace E
- 115 Blacks Mill Trace W
- 149 Pinewood Trail
- 275 Springwood Ln
- 369 Summerwood Ln
- 216 Forest Cove Ct
- 42 Springwood Ln
- 404 Barnwood Ln
- 286 Ivey Hollow Cir
- 31 Valleywood Ct
- 40 Ivey Hollow Cir
- 33 Ivey Hollow Cir
- 466 Quail Pass
- 16 Beech Ln S
- 1892 Blacks Mill Rd
- 427 Quail Pass
- 85 Hickory Hills Dr
- 143 Sequoia Ln
- 167 Sequoia Ln
- 251 Sequoia Ln
- 85 Blacks Mill Trace E
- 151 Blacks Mill Trace E
- 132 Blacks Mill Trace E
- 110 Blacks Mill Trace E
- 110 Blacks Mill Trace E
- 110 Blacks Mill Trace E Unit 110
- 63 Blacks Mill Trace E
- 31 Blacks Mill Trace E
- 152 Blacks Mill Trace E
- 31 Blacks Mill Trace E
- 96 Blacks Mill Trace E
- 74 Blacks Mill Trace E
- 27 Blacks Mill Trace E
- 193 Blacks Mill Trace E
- 64 Blacks Mill Trace E
- 9 Blacks Mill Trace E
- 203 Blacks Mill Trace E
- 190 Blacks Mill Trace E
- 132 Blacks Mill Dr
- 204 Blacks Mill Trace E
Your Personal Tour Guide
Ask me questions while you tour the home.