Estimated Value: $776,266 - $1,003,000
3
Beds
2
Baths
2,064
Sq Ft
$419/Sq Ft
Est. Value
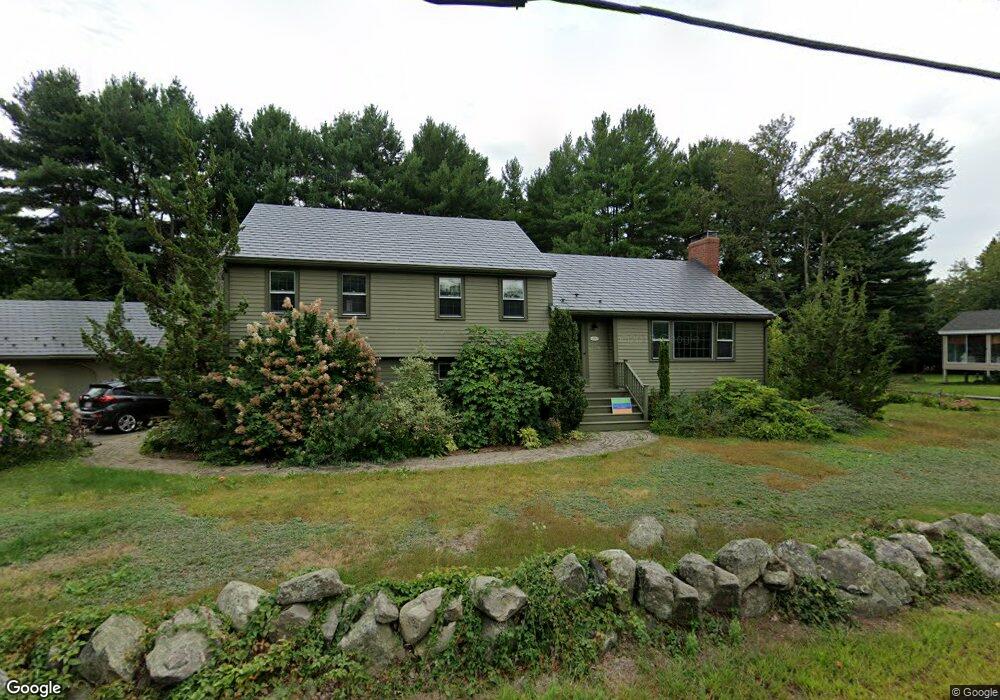
About This Home
This home is located at 109 Concord Rd, Acton, MA 01720 and is currently estimated at $865,817, approximately $419 per square foot. 109 Concord Rd is a home located in Middlesex County with nearby schools including Acton-Boxborough Regional High School and Nashoba Brooks School.
Ownership History
Date
Name
Owned For
Owner Type
Purchase Details
Closed on
May 28, 1993
Sold by
Harrah Joyce F
Bought by
Gerratt David and Simes Debra M
Current Estimated Value
Home Financials for this Owner
Home Financials are based on the most recent Mortgage that was taken out on this home.
Original Mortgage
$199,500
Interest Rate
7.41%
Mortgage Type
Purchase Money Mortgage
Create a Home Valuation Report for This Property
The Home Valuation Report is an in-depth analysis detailing your home's value as well as a comparison with similar homes in the area
Home Values in the Area
Average Home Value in this Area
Purchase History
| Date | Buyer | Sale Price | Title Company |
|---|---|---|---|
| Gerratt David | $210,000 | -- |
Source: Public Records
Mortgage History
| Date | Status | Borrower | Loan Amount |
|---|---|---|---|
| Open | Gerratt David | $193,500 | |
| Closed | Gerratt David | $199,500 | |
| Previous Owner | Gerratt David | $32,500 | |
| Previous Owner | Gerratt David | $14,100 |
Source: Public Records
Tax History
| Year | Tax Paid | Tax Assessment Tax Assessment Total Assessment is a certain percentage of the fair market value that is determined by local assessors to be the total taxable value of land and additions on the property. | Land | Improvement |
|---|---|---|---|---|
| 2025 | $11,617 | $677,400 | $313,700 | $363,700 |
| 2024 | $11,506 | $690,200 | $313,700 | $376,500 |
| 2023 | $10,854 | $618,100 | $285,300 | $332,800 |
| 2022 | $10,023 | $515,300 | $248,100 | $267,200 |
| 2021 | $9,937 | $491,200 | $229,400 | $261,800 |
| 2020 | $9,451 | $491,200 | $229,400 | $261,800 |
| 2019 | $9,433 | $487,000 | $229,400 | $257,600 |
| 2018 | $8,645 | $446,100 | $229,400 | $216,700 |
| 2017 | $8,432 | $442,400 | $229,400 | $213,000 |
| 2016 | $8,007 | $416,400 | $229,400 | $187,000 |
| 2015 | $7,422 | $389,600 | $229,400 | $160,200 |
| 2014 | $7,354 | $378,100 | $229,400 | $148,700 |
Source: Public Records
Map
Nearby Homes
Your Personal Tour Guide
Ask me questions while you tour the home.