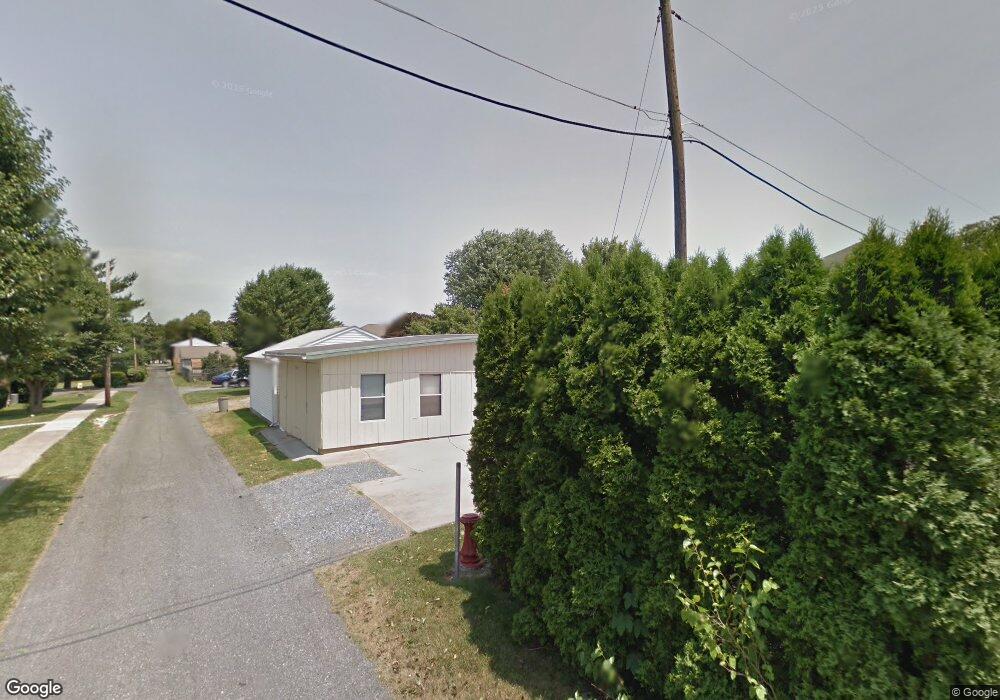
109 E Maple St Lebanon, PA 17046
Estimated Value: $222,000 - $240,000
3
Beds
2
Baths
1,206
Sq Ft
$189/Sq Ft
Est. Value
About This Home
This home is located at 109 E Maple St, Lebanon, PA 17046 and is currently estimated at $228,344, approximately $189 per square foot. 109 E Maple St is a home located in Lebanon County with nearby schools including Houck Elementary School, Lebanon Intermediate School, and Lebanon Senior High School.
Ownership History
Date
Name
Owned For
Owner Type
Purchase Details
Closed on
Nov 16, 2007
Sold by
Seiler Robert M and Dennis Melinda L
Bought by
Seiler Robert M and Seiler Melinda L
Current Estimated Value
Home Financials for this Owner
Home Financials are based on the most recent Mortgage that was taken out on this home.
Original Mortgage
$115,710
Outstanding Balance
$70,804
Interest Rate
6.37%
Mortgage Type
FHA
Estimated Equity
$157,540
Purchase Details
Closed on
Aug 24, 2006
Sold by
Williams Michael E
Bought by
Seiler Robert M and Seiler Dennis Melinda
Home Financials for this Owner
Home Financials are based on the most recent Mortgage that was taken out on this home.
Original Mortgage
$99,500
Interest Rate
8.74%
Mortgage Type
Adjustable Rate Mortgage/ARM
Create a Home Valuation Report for This Property
The Home Valuation Report is an in-depth analysis detailing your home's value as well as a comparison with similar homes in the area
Purchase History
| Date | Buyer | Sale Price | Title Company |
|---|---|---|---|
| Seiler Robert M | -- | None Available | |
| Seiler Robert M | $99,500 | None Available |
Source: Public Records
Mortgage History
| Date | Status | Borrower | Loan Amount |
|---|---|---|---|
| Open | Seiler Robert M | $115,710 | |
| Closed | Seiler Robert M | $99,500 |
Source: Public Records
Tax History
| Year | Tax Paid | Tax Assessment Tax Assessment Total Assessment is a certain percentage of the fair market value that is determined by local assessors to be the total taxable value of land and additions on the property. | Land | Improvement |
|---|---|---|---|---|
| 2026 | $3,729 | $112,700 | $18,200 | $94,500 |
| 2025 | $3,630 | $112,700 | $18,200 | $94,500 |
| 2024 | $3,459 | $112,700 | $18,200 | $94,500 |
| 2023 | $3,459 | $112,700 | $18,200 | $94,500 |
| 2022 | $3,403 | $112,700 | $18,200 | $94,500 |
| 2021 | $3,287 | $112,700 | $18,200 | $94,500 |
| 2020 | $3,287 | $112,700 | $18,200 | $94,500 |
| 2019 | $3,239 | $112,700 | $18,200 | $94,500 |
| 2018 | $3,146 | $112,700 | $18,200 | $94,500 |
| 2017 | $887 | $112,700 | $18,200 | $94,500 |
| 2016 | $3,073 | $113,100 | $18,200 | $94,900 |
| 2015 | $1,700 | $113,100 | $18,200 | $94,900 |
| 2014 | $1,700 | $113,100 | $18,200 | $94,900 |
Source: Public Records
Map
Nearby Homes
Your Personal Tour Guide
Ask me questions while you tour the home.