109 Grace St Fairfield, CT 06825
Tunxis Hill NeighborhoodEstimated Value: $548,188 - $1,094,000
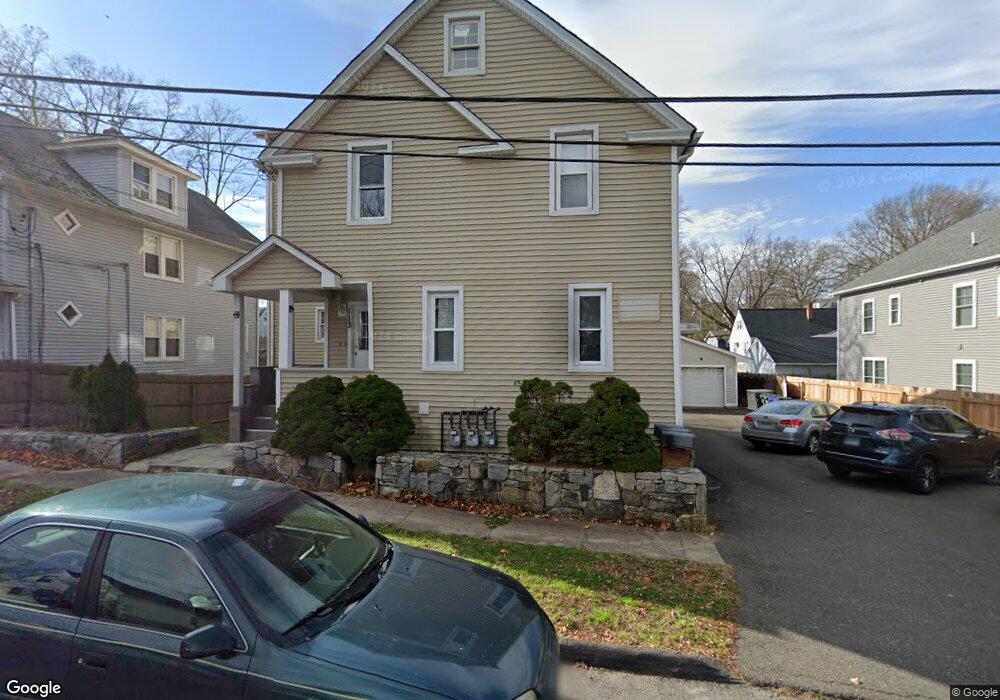
About This Home
This home is located at 109 Grace St, Fairfield, CT 06825 and is currently estimated at $845,547, approximately $243 per square foot. 109 Grace St is a home located in Fairfield County with nearby schools including Mckinley Elementary School, Tomlinson Middle School, and Fairfield Warde High School.
Ownership History
We collect this data history from publicly available records. To have your information removed, we recommend requesting removal directly through your county’s website.
Purchase Details
Home Financials for this Owner
Home Financials are based on the most recent Mortgage that was taken out on this home.Home Values in the Area
Average Home Value in this Area
Purchase History
We collect this data history from publicly available records. To have your information removed, we recommend requesting removal directly through your county’s website.
| Date | Buyer | Sale Price | Title Company |
|---|---|---|---|
| $350,000 | -- | ||
| $350,000 | -- |
Mortgage History
We collect this data history from publicly available records. To have your information removed, we recommend requesting removal directly through your county’s website.
| Date | Status | Borrower | Loan Amount |
|---|---|---|---|
| Open | $249,500 | ||
| Closed | $262,500 |
Tax History
We collect this data history from publicly available records. To have your information removed, we recommend requesting removal directly through your county’s website.
| Year | Tax Paid | Tax Assessment Tax Assessment Total Assessment is a certain percentage of the fair market value that is determined by local assessors to be the total taxable value of land and additions on the property. | Land | Improvement |
|---|---|---|---|---|
| 2025 | $9,195 | $323,890 | $178,290 | $145,600 |
| 2024 | $9,037 | $323,890 | $178,290 | $145,600 |
| 2023 | $8,910 | $323,890 | $178,290 | $145,600 |
| 2022 | $8,823 | $323,890 | $178,290 | $145,600 |
| 2021 | $8,739 | $323,890 | $178,290 | $145,600 |
| 2020 | $7,668 | $286,230 | $148,540 | $137,690 |
| 2019 | $7,668 | $286,230 | $148,540 | $137,690 |
| 2018 | $7,545 | $286,230 | $148,540 | $137,690 |
| 2017 | $7,390 | $286,230 | $148,540 | $137,690 |
| 2016 | $7,285 | $286,230 | $148,540 | $137,690 |
| 2015 | $7,398 | $298,410 | $154,350 | $144,060 |
| 2014 | $7,281 | $298,410 | $154,350 | $144,060 |
Map
- 45 Sterling St
- 47 Sterling St
- 51 Sterling St
- 53 Sterling St
- 101 Soundview Ave
- 65 Beaver St
- 216 Sterling St
- 198 Castle Ave
- 845 Knapps Hwy
- 430 Berkeley Rd
- 1117 Black Rock Turnpike Unit 1117
- 90 Silliman St Unit 3B
- 37 Biro St
- 352 Marlborough Terrace
- 781 Tunxis Hill Rd
- 65 Benton St
- 175 School St
- 282 Marlborough Terrace
- 309 Hunyadi Ave
- 241 Old Stratfield Rd
Ask me questions while you tour the home.