109 Mcanear St Cleburne, TX 76033
Estimated Value: $259,000 - $271,116
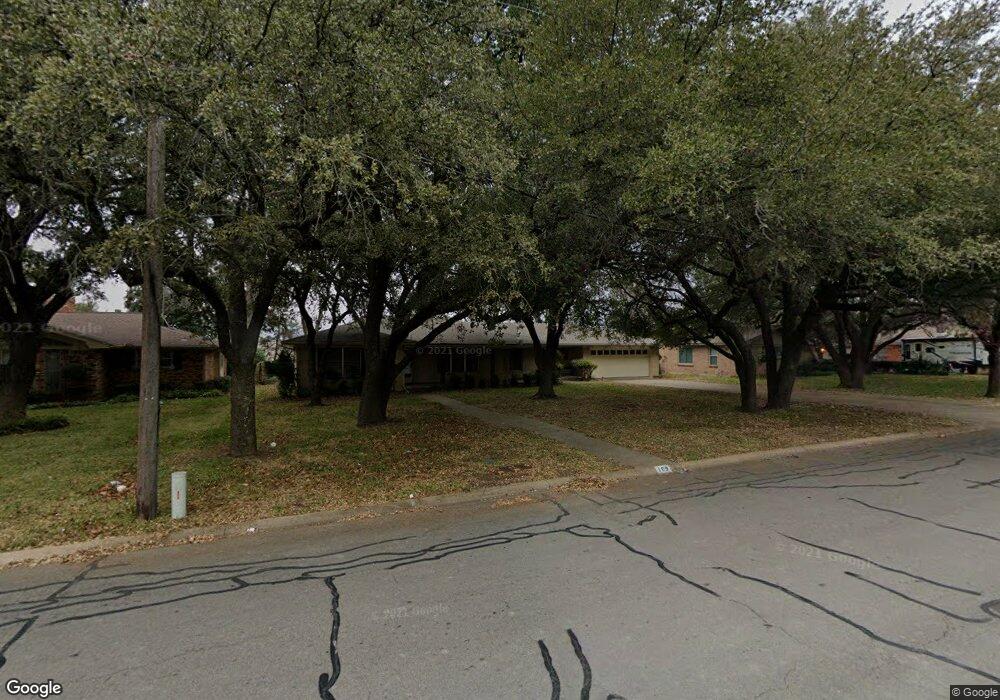
About This Home
This home is located at 109 Mcanear St, Cleburne, TX 76033 and is currently estimated at $263,029, approximately $132 per square foot. 109 Mcanear St is a home located in Johnson County with nearby schools including Marti Elementary School, A.D. Wheat Middle School, and Cleburne High School.
Ownership History
We collect this data history from publicly available records. To have your information removed, we recommend requesting removal directly through your county’s website.
Purchase Details
Home Financials for this Owner
Home Financials are based on the most recent Mortgage that was taken out on this home.Purchase Details
Home Values in the Area
Average Home Value in this Area
Purchase History
We collect this data history from publicly available records. To have your information removed, we recommend requesting removal directly through your county’s website.
| Date | Buyer | Sale Price | Title Company |
|---|---|---|---|
| -- | Capital Title | ||
| -- | Fatco |
Mortgage History
We collect this data history from publicly available records. To have your information removed, we recommend requesting removal directly through your county’s website.
| Date | Status | Borrower | Loan Amount |
|---|---|---|---|
| Open | $105,000 |
Tax History
We collect this data history from publicly available records. To have your information removed, we recommend requesting removal directly through your county’s website.
| Year | Tax Paid | Tax Assessment Tax Assessment Total Assessment is a certain percentage of the fair market value that is determined by local assessors to be the total taxable value of land and additions on the property. | Land | Improvement |
|---|---|---|---|---|
| 2025 | $1,286 | $151,993 | $38,500 | $113,493 |
| 2024 | $3,389 | $151,993 | $38,500 | $113,493 |
| 2023 | $1,277 | $151,993 | $38,500 | $113,493 |
| 2022 | $3,804 | $151,993 | $38,500 | $113,493 |
| 2021 | $3,966 | $151,993 | $38,500 | $113,493 |
| 2020 | $3,838 | $138,493 | $25,000 | $113,493 |
| 2019 | $3,780 | $138,493 | $25,000 | $113,493 |
| 2018 | $3,437 | $116,284 | $14,000 | $102,284 |
| 2017 | $3,423 | $116,284 | $14,000 | $102,284 |
| 2016 | $3,423 | $116,284 | $14,000 | $102,284 |
| 2015 | $1,124 | $115,494 | $14,000 | $101,494 |
| 2014 | $1,124 | $97,153 | $14,000 | $83,153 |
Map
- 203 Stroud St
- 1104 Sheridan Ln
- 1005 W Chambers St
- 911 W Chambers St
- 1018 Princeton Place
- 206 S Pendell Ave
- 1001 Princeton Place
- 504 Marsh St
- 529 Marsh St
- 508 W Willingham St
- 313 Crestridge Dr N
- 703 N Douglas Ave
- 542 W Wilson St
- 801 N Douglas Ave
- 216 Sunset Dr
- 541 Marsh St
- 701 Bass Lake Ln
- 802 Shady Creek Dr
- 557 Marsh St
- 104 Dixon St
Ask me questions while you tour the home.