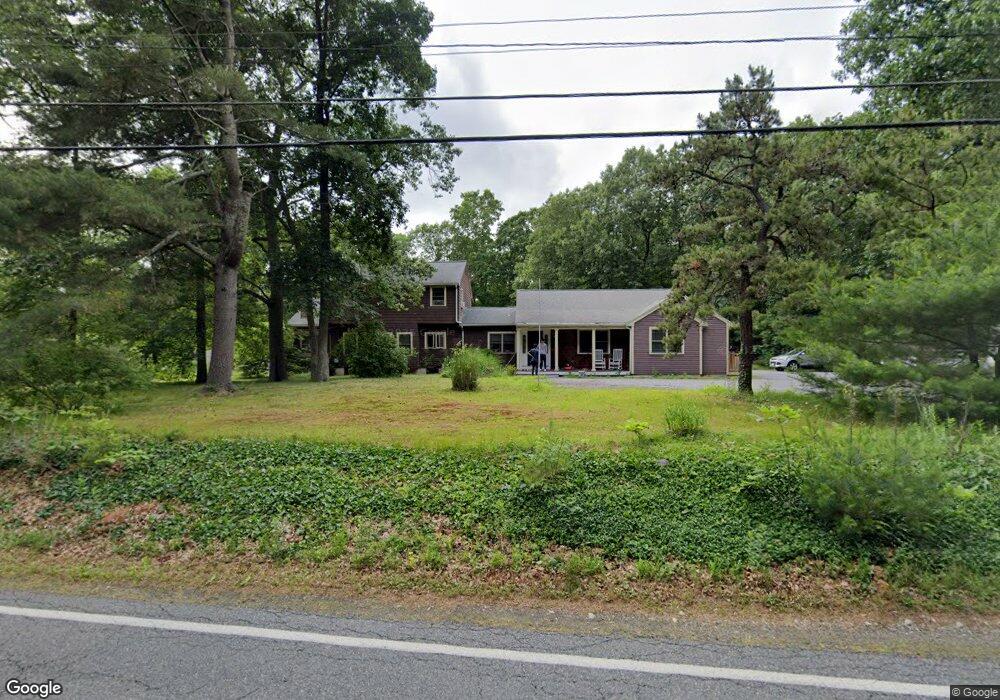
109 Morse St Foxboro, MA 02035
Estimated Value: $845,922 - $1,008,000
3
Beds
3
Baths
3,122
Sq Ft
$287/Sq Ft
Est. Value
About This Home
This home is located at 109 Morse St, Foxboro, MA 02035 and is currently estimated at $897,481, approximately $287 per square foot. 109 Morse St is a home located in Norfolk County with nearby schools including Foxborough High School, Hands-On-Montessori School, and St Mary's Catholic School.
Ownership History
Date
Name
Owned For
Owner Type
Purchase Details
Closed on
Apr 8, 2004
Sold by
Mbta
Bought by
Vandenboom Karl M and Vandenboom Kathleen M
Current Estimated Value
Home Financials for this Owner
Home Financials are based on the most recent Mortgage that was taken out on this home.
Original Mortgage
$165,000
Outstanding Balance
$77,322
Interest Rate
5.6%
Mortgage Type
Purchase Money Mortgage
Estimated Equity
$820,159
Create a Home Valuation Report for This Property
The Home Valuation Report is an in-depth analysis detailing your home's value as well as a comparison with similar homes in the area
Home Values in the Area
Average Home Value in this Area
Purchase History
| Date | Buyer | Sale Price | Title Company |
|---|---|---|---|
| Vandenboom Karl M | $150,000 | -- |
Source: Public Records
Mortgage History
| Date | Status | Borrower | Loan Amount |
|---|---|---|---|
| Open | Vandenboom Karl M | $165,000 |
Source: Public Records
Tax History
| Year | Tax Paid | Tax Assessment Tax Assessment Total Assessment is a certain percentage of the fair market value that is determined by local assessors to be the total taxable value of land and additions on the property. | Land | Improvement |
|---|---|---|---|---|
| 2025 | $9,102 | $688,500 | $216,400 | $472,100 |
| 2024 | $8,977 | $664,500 | $233,300 | $431,200 |
| 2023 | $8,665 | $609,800 | $222,100 | $387,700 |
| 2022 | $8,226 | $566,500 | $199,100 | $367,400 |
| 2021 | $7,918 | $537,200 | $189,200 | $348,000 |
| 2020 | $7,659 | $525,700 | $189,200 | $336,500 |
| 2019 | $7,393 | $502,900 | $189,700 | $313,200 |
| 2018 | $6,975 | $478,700 | $180,200 | $298,500 |
| 2017 | $6,855 | $455,800 | $177,200 | $278,600 |
| 2016 | $6,691 | $451,500 | $170,700 | $280,800 |
| 2015 | $6,413 | $422,200 | $127,200 | $295,000 |
| 2014 | $6,245 | $416,600 | $127,200 | $289,400 |
Source: Public Records
Map
Nearby Homes
- 104 Spring St
- 28 Angell St
- 16 County St
- 22 Pleasant St Unit B
- 8 Windsor Dr
- 9 Independence Dr Unit 9
- 356 Central St
- 54 Church St
- 266 N Main St Unit 8
- 39 Brook St
- 166 Chauncy St
- 28 Court St
- 69 Rumford Ave
- 5 Tiffney Rd
- 97 East St
- 14 Webb Place Unit 1A
- 150 Central St
- 27 Sullivan Way
- 165 Chestnut St Unit 2
- 4 Erick Rd Unit 99
Your Personal Tour Guide
Ask me questions while you tour the home.