Estimated Value: $470,272 - $548,000
2
Beds
2
Baths
923
Sq Ft
$565/Sq Ft
Est. Value
About This Home
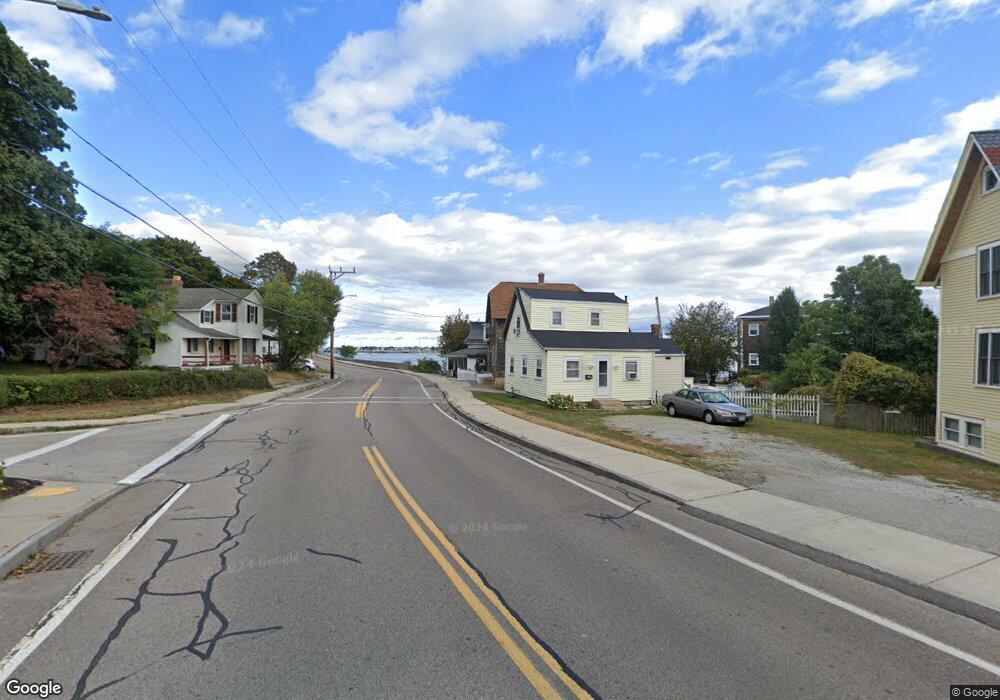
This home is located at 109 Spring St, Hull, MA 02045 and is currently estimated at $521,818, approximately $565 per square foot. 109 Spring St is a home located in Plymouth County with nearby schools including Lillian M. Jacobs Elementary School, Hull High School, and Memorial Middle School.
Ownership History
Date
Name
Owned For
Owner Type
Purchase Details
Closed on
Dec 31, 2004
Sold by
Trapp Gordon Paul
Bought by
Macgregor Brian M
Current Estimated Value
Home Financials for this Owner
Home Financials are based on the most recent Mortgage that was taken out on this home.
Original Mortgage
$256,800
Outstanding Balance
$129,483
Interest Rate
5.73%
Mortgage Type
Purchase Money Mortgage
Estimated Equity
$392,335
Purchase Details
Closed on
Aug 12, 1993
Sold by
Dominic Charles and Rossetti Elaine
Bought by
Hongvan Lam and Lam Jirawade
Create a Home Valuation Report for This Property
The Home Valuation Report is an in-depth analysis detailing your home's value as well as a comparison with similar homes in the area
Purchase History
| Date | Buyer | Sale Price | Title Company |
|---|---|---|---|
| Macgregor Brian M | $321,000 | -- | |
| Hongvan Lam | $63,000 | -- | |
| Hongvan Lam | $63,000 | -- |
Source: Public Records
Mortgage History
| Date | Status | Borrower | Loan Amount |
|---|---|---|---|
| Open | Hongvan Lam | $256,800 | |
| Closed | Hongvan Lam | $32,100 |
Source: Public Records
Tax History
| Year | Tax Paid | Tax Assessment Tax Assessment Total Assessment is a certain percentage of the fair market value that is determined by local assessors to be the total taxable value of land and additions on the property. | Land | Improvement |
|---|---|---|---|---|
| 2025 | $3,965 | $354,000 | $208,600 | $145,400 |
| 2024 | $3,992 | $342,700 | $202,100 | $140,600 |
| 2023 | $3,992 | $328,000 | $195,600 | $132,400 |
| 2022 | $3,682 | $293,600 | $182,600 | $111,000 |
| 2021 | $3,417 | $269,500 | $163,000 | $106,500 |
| 2020 | $3,436 | $268,000 | $163,000 | $105,000 |
| 2019 | $3,326 | $254,900 | $156,500 | $98,400 |
| 2018 | $3,288 | $245,000 | $156,500 | $88,500 |
| 2017 | $5,732 | $238,400 | $156,500 | $81,900 |
| 2016 | $3,037 | $225,300 | $143,400 | $81,900 |
| 2015 | $2,961 | $212,400 | $130,400 | $82,000 |
| 2014 | $2,946 | $212,400 | $130,400 | $82,000 |
Source: Public Records
Map
Nearby Homes
- 5 Telegraph Ave
- 14 Highland Ave
- 1169 Nantasket Ave Unit 2
- 3 Bayview St
- 1 Marina Dr
- 6 Marina Dr Unit 6
- 1092 Nantasket Ave
- 1 Commodore Ct Unit 202
- 19 Marina Dr Unit 19
- 40 Channel St
- 4 Glover Ave
- 180 Cadish Ave Unit 4
- 46 Sunset Ave
- 337 Beach Ave
- 34 F St
- 28 E St
- 9 C St
- 63 Halvorsen Ave
- 23 A St
- 47 B St Unit beachside
- 10 Main St
- 10 Main St
- 107 Spring St
- 6 Main St
- 27 James Ave
- 25 James Ave
- 0 Main St
- 105 Spring St
- 25 James Ave 15k July Aug 6k May Unit Jun
- 4 Main St
- 113 Spring St
- 110 Spring St
- 110 Spring St Unit 1
- 110 Spring St Unit 2
- 0 Mount Pleasant Ave
- 2 Main St
- 16 Main St
- 115 Spring St
- 34 Douglas Ave
- 34 Douglas Ave Unit 1
Your Personal Tour Guide
Ask me questions while you tour the home.