109 Tyler St Methuen, MA 01844
The West End NeighborhoodEstimated Value: $527,000 - $603,000
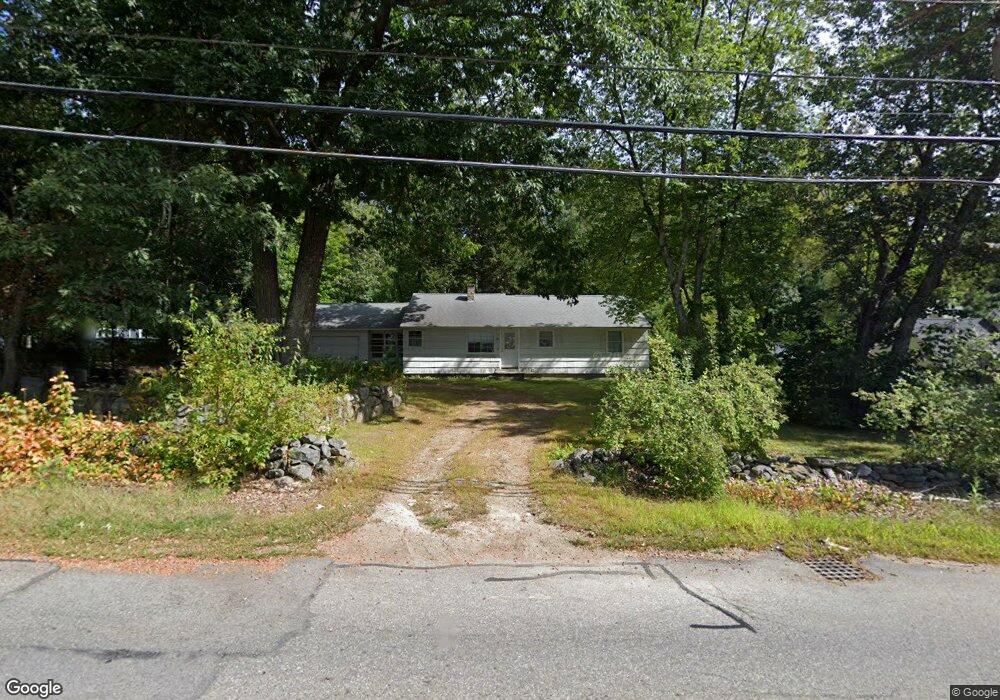
About This Home
This home is located at 109 Tyler St, Methuen, MA 01844 and is currently estimated at $566,689, approximately $562 per square foot. 109 Tyler St is a home located in Essex County with nearby schools including Marsh Grammar School, Methuen High School, and The Islamic Academy For Peace.
Ownership History
We collect this data history from publicly available records. To have your information removed, we recommend requesting removal directly through your county’s website.
Purchase Details
Purchase Details
Purchase Details
Home Financials for this Owner
Home Financials are based on the most recent Mortgage that was taken out on this home.Home Values in the Area
Average Home Value in this Area
Purchase History
We collect this data history from publicly available records. To have your information removed, we recommend requesting removal directly through your county’s website.
| Date | Buyer | Sale Price | Title Company |
|---|---|---|---|
| -- | -- | ||
| -- | -- | ||
| $200,000 | -- |
Mortgage History
We collect this data history from publicly available records. To have your information removed, we recommend requesting removal directly through your county’s website.
| Date | Status | Borrower | Loan Amount |
|---|---|---|---|
| Previous Owner | $145,000 |
Tax History
We collect this data history from publicly available records. To have your information removed, we recommend requesting removal directly through your county’s website.
| Year | Tax Paid | Tax Assessment Tax Assessment Total Assessment is a certain percentage of the fair market value that is determined by local assessors to be the total taxable value of land and additions on the property. | Land | Improvement |
|---|---|---|---|---|
| 2025 | $5,503 | $520,100 | $319,100 | $201,000 |
| 2024 | $5,333 | $491,100 | $290,100 | $201,000 |
| 2023 | $5,232 | $447,200 | $259,000 | $188,200 |
| 2022 | $4,866 | $372,900 | $207,200 | $165,700 |
| 2021 | $4,589 | $347,900 | $196,900 | $151,000 |
| 2020 | $4,601 | $342,300 | $196,900 | $145,400 |
| 2019 | $4,420 | $311,500 | $186,500 | $125,000 |
| 2018 | $4,351 | $304,900 | $186,500 | $118,400 |
| 2017 | $4,288 | $292,700 | $186,500 | $106,200 |
| 2016 | $4,253 | $287,200 | $186,500 | $100,700 |
| 2015 | $4,145 | $283,900 | $186,500 | $97,400 |
Map
- 41 Riverview Ave
- 3 Avalon Ct
- 16 Newhill Rd
- 21 Newhill Rd
- 14 Rebecca Way
- 524 Lowell St
- 173 Forest St
- 8 Beeston Ln
- 9 Giles St
- 111 Woodburn Dr
- 26 Hobson St
- 294 Salem Rd
- 302 Salem Rd
- 945 Riverside Dr Unit 29D
- 54 Maplewood Ave
- 8 Glen Forest Ln
- 219 Pelham St
- 4 Capitol St
- 102 Edgewood Ave
- 82-84 Haverhill St
- 156 Butternut Ln
- 107 Tyler St
- 23 Mount Holly Dr
- 154 Butternut Ln
- 105 Tyler St
- 27 Mount Holly Dr
- 42 Tyler St
- 191 Butternut Ln
- 51 Tyler St
- 120 Tyler St
- 19 Mount Holly Dr
- 31 Mount Holly Dr
- 187 Butternut Ln
- 7 Mount Holly Dr
- 10 Beechnut St
- 9 Mount Holly Dr
- 30 Tyler St
- 117 Tyler St
- 6 Beechnut St
- 4 Pheasant Hill Ln
Ask me questions while you tour the home.