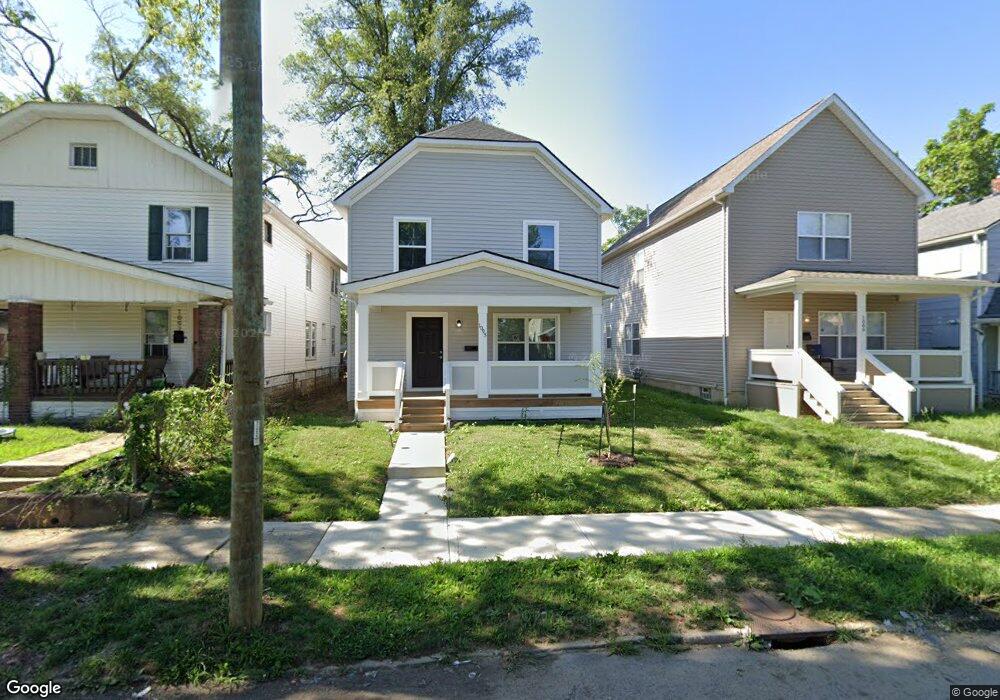
1095 E 16th Ave Columbus, OH 43211
South Linden NeighborhoodEstimated Value: $175,000 - $193,926
3
Beds
3
Baths
1,440
Sq Ft
$128/Sq Ft
Est. Value
About This Home
This home is located at 1095 E 16th Ave, Columbus, OH 43211 and is currently estimated at $184,982, approximately $128 per square foot. 1095 E 16th Ave is a home located in Franklin County with nearby schools including Windsor Stem Acadmey, Linden-Mckinley Stem School On Arcadia, and North Columbus Preparatory Academy.
Ownership History
Date
Name
Owned For
Owner Type
Purchase Details
Closed on
Oct 27, 2022
Sold by
Healthy Linden Homes Llc
Bought by
Healthy Linden Homes Ii Llc
Current Estimated Value
Purchase Details
Closed on
Oct 28, 2021
Sold by
City Of Columbus Ohio
Bought by
Healthy Linden Homes Llc
Purchase Details
Closed on
Mar 28, 2017
Sold by
Central Ohia Community Omprovement Crop
Bought by
City Of Columbus
Purchase Details
Closed on
Nov 1, 2016
Sold by
Burchfield Randolph
Bought by
City Of Columbus
Purchase Details
Closed on
Nov 22, 2007
Sold by
Burchfield Dorothy A and Burchfield James R
Bought by
Burchfield James R and Burchfield Revocable T James R
Purchase Details
Closed on
Mar 27, 2007
Sold by
Kormanik Paul S and Estate Of Betty L Smith
Bought by
Burchfield James R
Purchase Details
Closed on
Dec 28, 1973
Bought by
Burchfield James R
Create a Home Valuation Report for This Property
The Home Valuation Report is an in-depth analysis detailing your home's value as well as a comparison with similar homes in the area
Home Values in the Area
Average Home Value in this Area
Purchase History
| Date | Buyer | Sale Price | Title Company |
|---|---|---|---|
| Healthy Linden Homes Ii Llc | -- | -- | |
| Healthy Linden Homes Llc | -- | Bennington Jeff | |
| City Of Columbus | -- | None Available | |
| City Of Columbus | -- | None Available | |
| Burchfield James R | -- | Attorney | |
| Burchfield James R | $2,800 | None Available | |
| Burchfield James R | -- | -- |
Source: Public Records
Tax History
| Year | Tax Paid | Tax Assessment Tax Assessment Total Assessment is a certain percentage of the fair market value that is determined by local assessors to be the total taxable value of land and additions on the property. | Land | Improvement |
|---|---|---|---|---|
| 2025 | $234 | $70,630 | $5,110 | $65,520 |
| 2024 | $234 | $70,630 | $5,110 | $65,520 |
| 2023 | $1,391 | $30,730 | $5,110 | $25,620 |
| 2022 | $0 | $2,100 | $2,100 | $0 |
| 2021 | $0 | $2,100 | $2,100 | $0 |
| 2020 | $0 | $2,100 | $2,100 | $0 |
| 2019 | $35 | $1,750 | $1,750 | $0 |
| 2018 | $35 | $1,750 | $1,750 | $0 |
| 2017 | $0 | $1,750 | $1,750 | $0 |
| 2016 | $516 | $1,120 | $1,120 | $0 |
| 2015 | $69 | $1,120 | $1,120 | $0 |
| 2014 | $69 | $1,120 | $1,120 | $0 |
| 2013 | $39 | $1,260 | $1,260 | $0 |
Source: Public Records
Map
Nearby Homes
- 1111-1113 E 16th Ave
- 1070 E 16th Ave
- 1129 E 17th Ave
- 1673 Cleveland Ave
- 1157-1159 E 18th Ave
- 1027 E 14th Ave
- 1037 E 18th Ave
- 990 E 16th Ave
- 1012 E 17th Ave
- 1111 Windsor Ave
- 1121 Windsor Ave
- 1705 Lexington Ave
- 957 E 17th Ave
- 1078 E 19th Ave
- 957 E 13th Ave
- 1249-1251 E 15th Ave
- 1272 E 15th Ave
- 1045-1051 E 20th Ave
- 1538-1542 Accommodation Ave
- 915 E 13th Ave
- 1089 E 16th Ave
- 1097 E 16th Ave Unit 99
- 1085 E 16th Ave Unit 87
- 1085 E 16th Ave Unit 10
- 1103 E 16th Ave
- 1079 E 16th Ave
- 1109 E 16th Ave
- 1092 E 16th Ave
- 1075 E 16th Ave
- 1088 E 16th Ave
- 1102 E 16th Ave Unit 104
- 1102 E 16th Ave Unit 104
- 1102 E 16th Ave
- 1111 E 16th Ave
- 1082-1084 E 16th Ave
- 1082 E 16th Ave Unit 84
- 1110 E 16th Ave
- 1084 E 15th Ave
- 1078 E 16th Ave
- 1092-1094 E 15th Ave
Your Personal Tour Guide
Ask me questions while you tour the home.