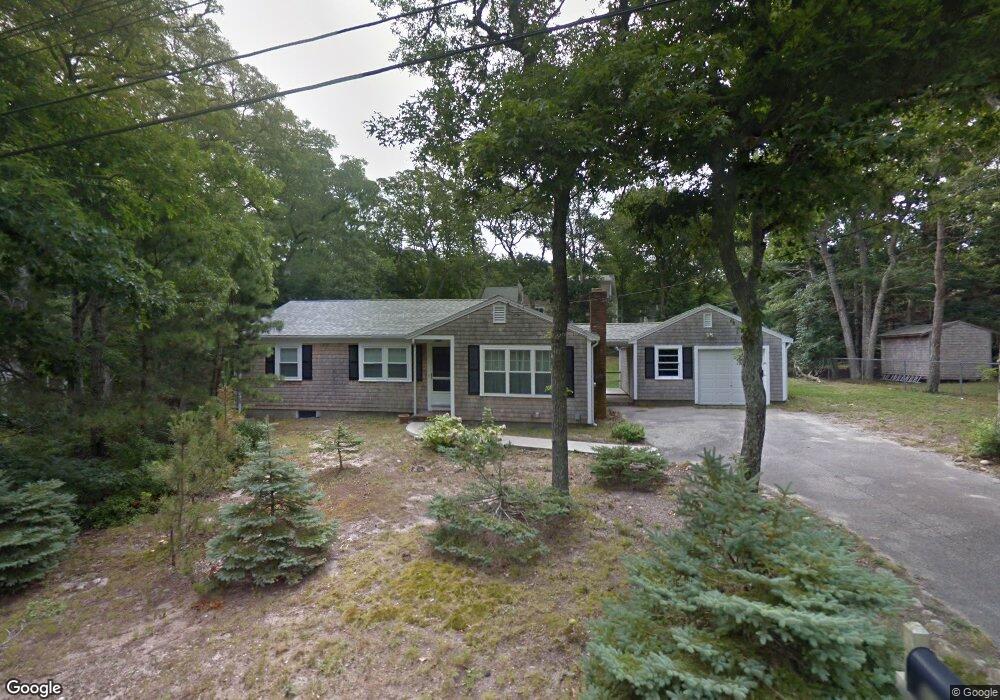
11 7th St Harwich, MA 02645
Northwest Harwich NeighborhoodEstimated Value: $574,529 - $618,000
3
Beds
2
Baths
1,064
Sq Ft
$552/Sq Ft
Est. Value
About This Home
This home is located at 11 7th St, Harwich, MA 02645 and is currently estimated at $587,132, approximately $551 per square foot. 11 7th St is a home located in Barnstable County with nearby schools including Harwich Elementary School, Chatham Elementary School, and Monomoy Regional Middle School.
Ownership History
Date
Name
Owned For
Owner Type
Purchase Details
Closed on
Nov 23, 2021
Sold by
Airasian Gregory P
Bought by
Airasian Ft
Current Estimated Value
Purchase Details
Closed on
Aug 18, 2021
Sold by
Airasian Lynn A
Bought by
Lynn A Airasian T
Purchase Details
Closed on
Dec 27, 2012
Sold by
Airasian Peter W
Bought by
Airasian Lynn A and Airasian Gregory P
Purchase Details
Closed on
Mar 30, 2011
Sold by
Airasian Peter W
Bought by
Airasian Peter William and Airasian Lynn A
Purchase Details
Closed on
Nov 17, 1972
Bought by
Airasian Lynn Anne and Airasian Gregory Peter
Create a Home Valuation Report for This Property
The Home Valuation Report is an in-depth analysis detailing your home's value as well as a comparison with similar homes in the area
Home Values in the Area
Average Home Value in this Area
Purchase History
We collect this data history from publicly available records. To have your information removed, we recommend requesting removal directly through your county’s website.
| Date | Buyer | Sale Price | Title Company |
|---|---|---|---|
| Airasian Ft | -- | None Available | |
| Lynn A Airasian T | -- | None Available | |
| Airasian Lynn A | -- | -- | |
| Airasian Peter W | -- | -- | |
| Airasian Peter William | -- | -- | |
| Airasian Lynn Anne | -- | -- |
Source: Public Records
Tax History
| Year | Tax Paid | Tax Assessment Tax Assessment Total Assessment is a certain percentage of the fair market value that is determined by local assessors to be the total taxable value of land and additions on the property. | Land | Improvement |
|---|---|---|---|---|
| 2025 | $3,476 | $588,200 | $249,400 | $338,800 |
| 2024 | $3,371 | $559,100 | $235,300 | $323,800 |
| 2023 | $3,215 | $484,200 | $213,900 | $270,300 |
| 2022 | $3,195 | $394,000 | $186,100 | $207,900 |
| 2021 | $2,990 | $347,700 | $169,100 | $178,600 |
| 2020 | $2,939 | $336,700 | $162,600 | $174,100 |
| 2019 | $2,780 | $320,700 | $154,200 | $166,500 |
| 2018 | $2,707 | $307,600 | $140,200 | $167,400 |
| 2017 | $2,611 | $291,100 | $132,500 | $158,600 |
| 2016 | $2,561 | $282,400 | $132,500 | $149,900 |
| 2015 | $2,470 | $275,400 | $129,900 | $145,500 |
| 2014 | $2,241 | $255,500 | $112,500 | $143,000 |
Source: Public Records
Map
Nearby Homes
- 14 2nd St
- 36 Lakewood Dr
- 25 Cedardale Rd
- 23 Prince Charles Dr
- 3 Bentley Rd
- 72 Winstead Rd
- 5 Bentley Rd
- 7 Bentley Rd
- 1 Bentley Rd
- 9 Bentley Rd
- 13 Harwich Pines
- 19 Walkerwoods Dr
- 92 Azalea Dr
- 8 Oakleaf Cir
- 147 Brook Trail Rd
- 26 Walkerwoods Dr
- 206 Landing Dr
- 210 Pine Bluff Rd
- 28 Alder Ln
- 12 Inkberry Ln
Your Personal Tour Guide
Ask me questions while you tour the home.