11 Allen St Worcester, MA 01610
Main South NeighborhoodEstimated Value: $693,000 - $802,000
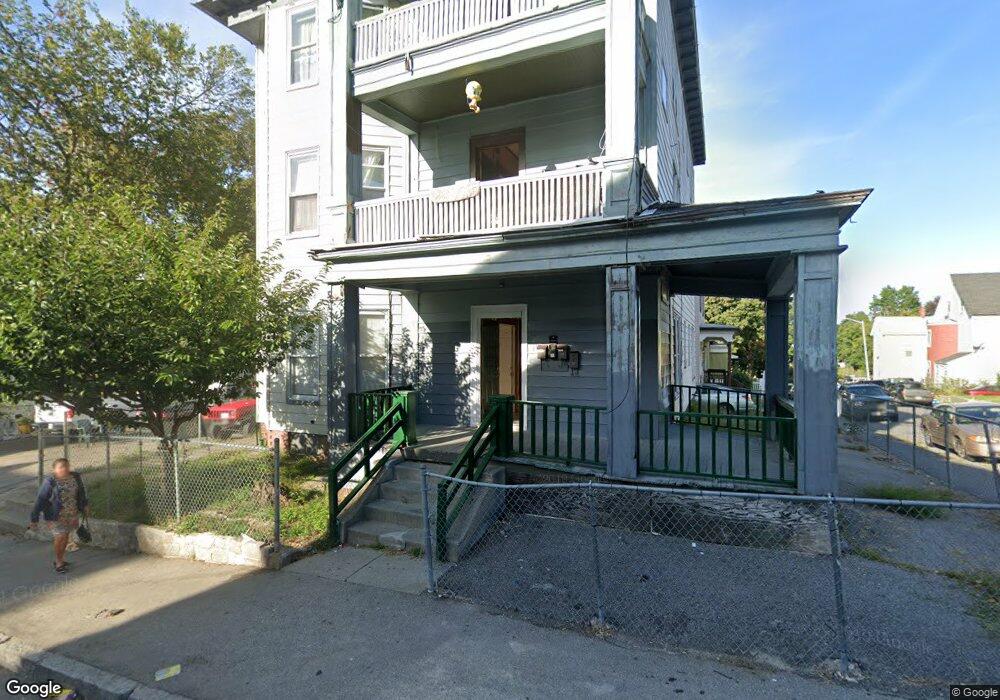
About This Home
This home is located at 11 Allen St, Worcester, MA 01610 and is currently estimated at $764,667, approximately $178 per square foot. 11 Allen St is a home located in Worcester County with nearby schools including Jacob Hiatt Magnet School, Chandler Magnet, and Woodland Academy.
Ownership History
We collect this data history from publicly available records. To have your information removed, we recommend requesting removal directly through your county’s website.
Purchase Details
Purchase Details
Home Values in the Area
Average Home Value in this Area
Purchase History
We collect this data history from publicly available records. To have your information removed, we recommend requesting removal directly through your county’s website.
| Date | Buyer | Sale Price | Title Company |
|---|---|---|---|
| $203,000 | -- | ||
| $112,000 | -- |
Mortgage History
We collect this data history from publicly available records. To have your information removed, we recommend requesting removal directly through your county’s website.
| Date | Status | Borrower | Loan Amount |
|---|---|---|---|
| Previous Owner | $95,300 |
Tax History
We collect this data history from publicly available records. To have your information removed, we recommend requesting removal directly through your county’s website.
| Year | Tax Paid | Tax Assessment Tax Assessment Total Assessment is a certain percentage of the fair market value that is determined by local assessors to be the total taxable value of land and additions on the property. | Land | Improvement |
|---|---|---|---|---|
| 2025 | $7,783 | $590,100 | $70,900 | $519,200 |
| 2024 | $7,146 | $519,700 | $70,900 | $448,800 |
| 2023 | $6,789 | $473,400 | $56,900 | $416,500 |
| 2022 | $5,911 | $388,600 | $45,500 | $343,100 |
| 2021 | $5,299 | $325,500 | $36,400 | $289,100 |
| 2020 | $4,879 | $287,000 | $36,500 | $250,500 |
| 2019 | $4,394 | $244,100 | $36,000 | $208,100 |
| 2018 | $4,287 | $226,700 | $36,000 | $190,700 |
| 2017 | $4,011 | $208,700 | $36,000 | $172,700 |
| 2016 | $3,918 | $190,100 | $29,700 | $160,400 |
| 2015 | $3,815 | $190,100 | $29,700 | $160,400 |
| 2014 | $3,715 | $190,100 | $29,700 | $160,400 |
Map
- 6 Mount Pleasant St
- 7 Allen St
- 10 Allen St Unit 1F
- 10 Allen St Unit 2F
- 14 Allen St
- 8 Allen St Unit 3R
- 8 Allen St Unit 2F
- 8 Allen St Unit 3F
- 8 Allen St Unit 1R
- 8 Allen St
- 5 Allen St Unit 4
- 4 Mount Pleasant St
- 7 Mt Pleasant Unit 2L
- 7 Mount Pleasant St
- 7 Mt Pleasant
- 5 Mount Pleasant St Unit 3
- 5 Mount Pleasant St Unit 2
- 16 Allen St
- 3 Mount Pleasant St
- 3 Mount Pleasant St Unit 3
Ask me questions while you tour the home.