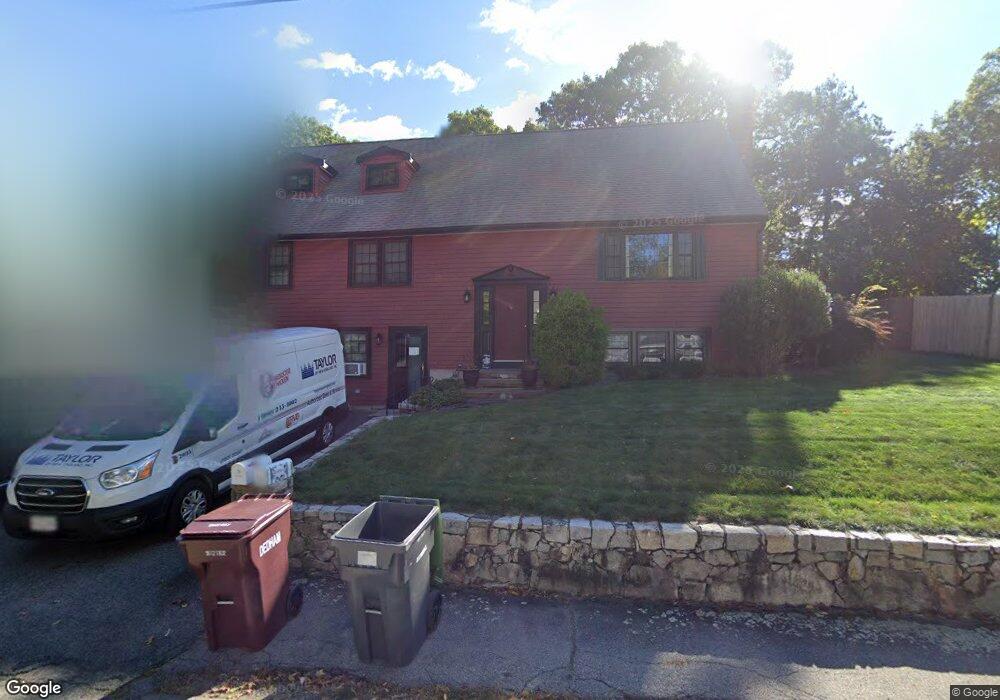
11 Anthony Ln Dedham, MA 02026
Dedham Village NeighborhoodEstimated Value: $911,000 - $1,004,000
4
Beds
2
Baths
2,096
Sq Ft
$451/Sq Ft
Est. Value
About This Home
This home is located at 11 Anthony Ln, Dedham, MA 02026 and is currently estimated at $946,321, approximately $451 per square foot. 11 Anthony Ln is a home located in Norfolk County with nearby schools including Riverdale Elementary School, Dedham Middle School, and Dedham High School.
Ownership History
Date
Name
Owned For
Owner Type
Purchase Details
Closed on
Jan 12, 2018
Sold by
Emery Dorothea A
Bought by
Emery Ft
Current Estimated Value
Purchase Details
Closed on
Aug 6, 1981
Bought by
Emery Charles F and Emery Dorothea A
Create a Home Valuation Report for This Property
The Home Valuation Report is an in-depth analysis detailing your home's value as well as a comparison with similar homes in the area
Home Values in the Area
Average Home Value in this Area
Purchase History
| Date | Buyer | Sale Price | Title Company |
|---|---|---|---|
| Emery Ft | -- | -- | |
| Emery Ft | -- | -- | |
| Emery Charles F | -- | -- |
Source: Public Records
Mortgage History
| Date | Status | Borrower | Loan Amount |
|---|---|---|---|
| Previous Owner | Emery Charles F | $15,000 | |
| Previous Owner | Emery Charles F | $15,000 | |
| Previous Owner | Emery Charles F | $15,000 |
Source: Public Records
Tax History
| Year | Tax Paid | Tax Assessment Tax Assessment Total Assessment is a certain percentage of the fair market value that is determined by local assessors to be the total taxable value of land and additions on the property. | Land | Improvement |
|---|---|---|---|---|
| 2025 | $11,040 | $874,800 | $382,400 | $492,400 |
| 2024 | $10,926 | $874,100 | $367,500 | $506,600 |
| 2023 | $9,647 | $751,300 | $322,500 | $428,800 |
| 2022 | $8,686 | $650,600 | $294,900 | $355,700 |
| 2021 | $8,255 | $603,900 | $299,900 | $304,000 |
| 2020 | $8,178 | $596,100 | $287,000 | $309,100 |
| 2019 | $8,066 | $570,000 | $278,300 | $291,700 |
| 2018 | $7,890 | $542,300 | $250,600 | $291,700 |
| 2017 | $7,488 | $507,300 | $222,100 | $285,200 |
| 2016 | $7,959 | $513,800 | $200,600 | $313,200 |
| 2015 | $7,879 | $496,500 | $230,400 | $266,100 |
| 2014 | $8,183 | $508,900 | $230,400 | $278,500 |
Source: Public Records
Map
Nearby Homes
- 1000 Washington St Unit 205
- 213 Sandy Valley Rd
- 14 Eldridge Place
- 165 Highland St Unit 165
- 223 Robert Rd
- 59 Grafton Ave
- 86 Horrigan Dr Unit 23
- 87 Horrigan Dr Unit 8
- 80 Horrigan Dr Unit 24
- 66 Horrigan Dr Unit 25
- 57 Horrigan Dr Unit 3
- 37 Horrigan Dr Unit 1
- 290 East St
- 441 Washington St Unit 301
- 441 Washington St Unit 302
- 44 Court St
- 47 Village Ave Unit 203
- 46 Church St
- 1133 High
- 39 Westbrook Ln
Your Personal Tour Guide
Ask me questions while you tour the home.