M
Seller's Agent in 2020
Mark Jenkins
Wallace & Co. Sotheby's


Estimated Value: $5,791,000 - $6,762,243
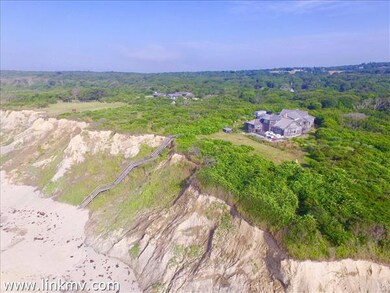
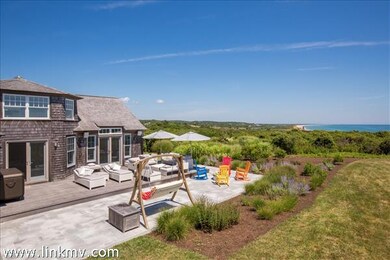
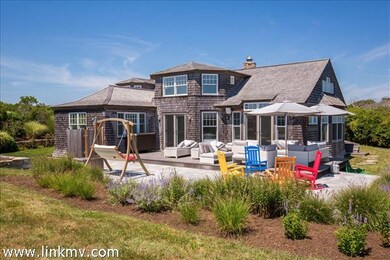
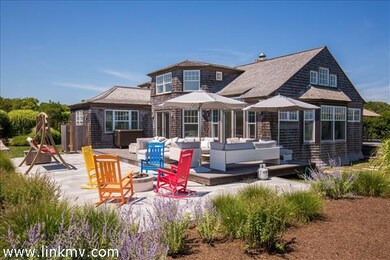
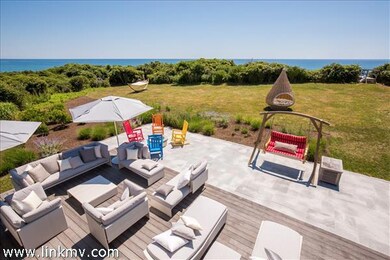
With 425 ft of private ocean beach, this offering deserves its reputation as the "ultimate beach house". The 5-bedroom home has been completely renovated to the highest specifications with a focus on bold contemporary choices to take advantage of the views and setting. The beach stairs provide access to a wide swath of sand that many consider the most beautiful stretch of beach on Martha's Vineyard. The property is being offered mostly furnished. To fully appreciate this extraordinary setting, view the images in the "photo gallery" and watch this drone video:
Last Agent to Sell the Property
Mark Jenkins
Wallace & Co. Sotheby's Listed on: 05/29/2020
Last Buyer's Agent
Cassie Courtney
Wallace & Co. Sotheby's
| Date | Buyer | Sale Price | Title Company |
|---|---|---|---|
| Schargel Gail | $3,750,000 | None Available | |
| Lucy Beach Llc | $4,000,000 | -- | |
| Azalea Lane Llc | $2,475,000 | -- | |
| Frankel Randolph | -- | -- | |
| Randolph B Frankel Ret | -- | -- |
| Date | Status | Borrower | Loan Amount |
|---|---|---|---|
| Previous Owner | Lucy Beach Llc | $2,000,000 | |
| Previous Owner | Lucy Beach Llc | $800,000 |
| Date | Event | Price | List to Sale | Price per Sq Ft | Prior Sale |
|---|---|---|---|---|---|
| 07/31/2020 07/31/20 | Sold | $3,750,000 | -6.3% | $1,000 / Sq Ft | |
| 07/20/2020 07/20/20 | Pending | -- | -- | -- | |
| 05/29/2020 05/29/20 | For Sale | $4,000,000 | 0.0% | $1,067 / Sq Ft | |
| 08/10/2012 08/10/12 | Sold | $4,000,000 | -- | $1,000 / Sq Ft | View Prior Sale |
| Year | Tax Paid | Tax Assessment Tax Assessment Total Assessment is a certain percentage of the fair market value that is determined by local assessors to be the total taxable value of land and additions on the property. | Land | Improvement |
|---|---|---|---|---|
| 2025 | $14,022 | $6,231,800 | $4,084,500 | $2,147,300 |
| 2024 | $12,826 | $6,050,200 | $3,954,300 | $2,095,900 |
| 2023 | $12,270 | $4,665,300 | $3,041,600 | $1,623,700 |
| 2022 | $10,655 | $3,778,500 | $2,291,900 | $1,486,600 |
| 2021 | $10,774 | $3,702,300 | $2,534,900 | $1,167,400 |
| 2020 | $11,065 | $3,868,900 | $2,723,500 | $1,145,400 |
| 2019 | $10,890 | $3,781,400 | $2,723,500 | $1,057,900 |
| 2018 | $10,399 | $3,781,400 | $2,723,500 | $1,057,900 |
| 2017 | $10,077 | $3,760,200 | $2,723,500 | $1,036,700 |
| 2016 | $10,169 | $3,752,300 | $2,723,500 | $1,028,800 |
| 2015 | $9,899 | $3,763,900 | $2,723,500 | $1,040,400 |
| 2014 | $10,014 | $4,038,000 | $3,342,000 | $696,000 |
M
Seller's Agent in 2020
Mark Jenkins
Wallace & Co. Sotheby's
C
Buyer's Agent in 2020
Cassie Courtney
Wallace & Co. Sotheby's
L
Seller's Agent in 2012
LINK Email Cache
LINK
Source: LINK (Vineyard)
MLS Number: 36676
APN: CHIL-000029-000000-000007
Ask me questions while you tour the home.