11 Bach Ct Walpole, MA 02081
Estimated Value: $1,158,000 - $1,429,000
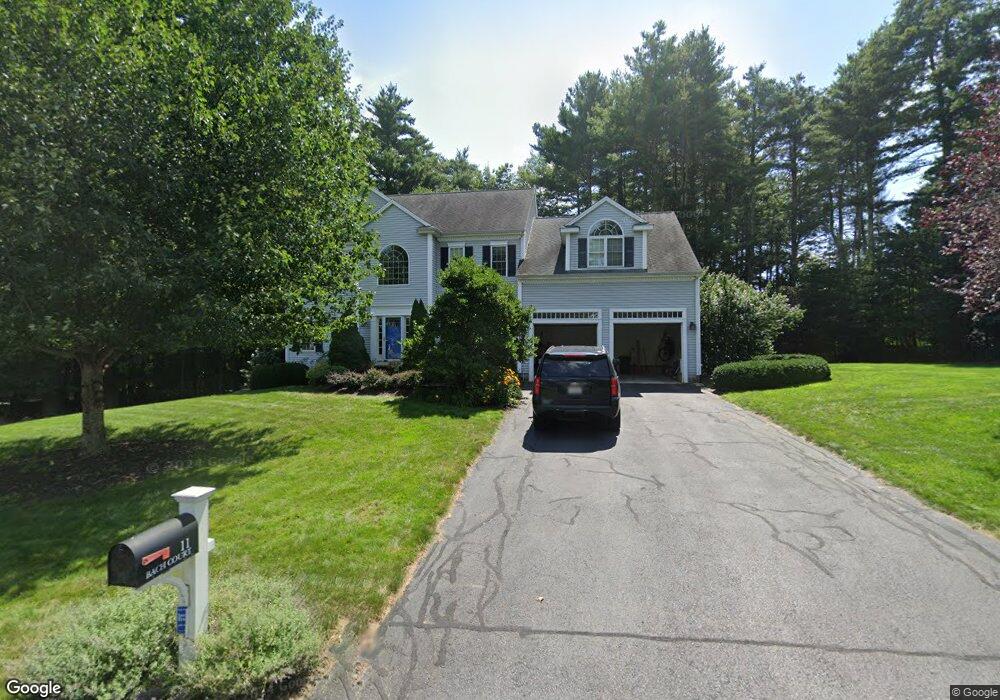
About This Home
This home is located at 11 Bach Ct, Walpole, MA 02081 and is currently estimated at $1,270,206, approximately $391 per square foot. 11 Bach Ct is a home located in Norfolk County with nearby schools including Elm Street School, Eleanor N. Johnson Middle School, and Walpole High School.
Ownership History
We collect this data history from publicly available records. To have your information removed, we recommend requesting removal directly through your county’s website.
Purchase Details
Home Financials for this Owner
Home Financials are based on the most recent Mortgage that was taken out on this home.Home Values in the Area
Average Home Value in this Area
Purchase History
We collect this data history from publicly available records. To have your information removed, we recommend requesting removal directly through your county’s website.
| Date | Buyer | Sale Price | Title Company |
|---|---|---|---|
| $607,753 | -- | ||
| $100,000 | -- |
Mortgage History
We collect this data history from publicly available records. To have your information removed, we recommend requesting removal directly through your county’s website.
| Date | Status | Borrower | Loan Amount |
|---|---|---|---|
| Open | $486,100 |
Tax History
We collect this data history from publicly available records. To have your information removed, we recommend requesting removal directly through your county’s website.
| Year | Tax Paid | Tax Assessment Tax Assessment Total Assessment is a certain percentage of the fair market value that is determined by local assessors to be the total taxable value of land and additions on the property. | Land | Improvement |
|---|---|---|---|---|
| 2025 | $14,812 | $1,154,500 | $384,600 | $769,900 |
| 2024 | $14,264 | $1,079,000 | $369,900 | $709,100 |
| 2023 | $13,168 | $948,000 | $321,500 | $626,500 |
| 2022 | $12,080 | $835,400 | $297,500 | $537,900 |
| 2021 | $11,894 | $801,500 | $280,600 | $520,900 |
| 2020 | $11,204 | $747,400 | $264,800 | $482,600 |
| 2019 | $10,860 | $719,200 | $255,600 | $463,600 |
| 2018 | $10,515 | $688,600 | $243,600 | $445,000 |
| 2017 | $10,230 | $667,300 | $234,300 | $433,000 |
| 2016 | $9,972 | $640,900 | $227,800 | $413,100 |
| 2015 | $9,726 | $619,500 | $218,400 | $401,100 |
| 2014 | $9,390 | $595,800 | $218,400 | $377,400 |
Map
- 48 Beethoven Ave
- 3 Carl Rd
- 22 Main St
- 51 Main St
- 1 Needham St
- 6 Spring St
- 12 Brookside Ln
- 9 Brookside Ln
- 21 Chandler Ave
- 3 Drone Rd
- 349 Lincoln Rd
- 27 Thomas Mann Cir Unit 18
- 37 Thomas Mann Cir Unit 23
- 47 Thomas Mann Cir Unit 28
- 13 Boyde's Crossing Unit 12
- 13 Boyde's Crossing
- 57 Thomas Mann Cir Unit 33
- 85 Broad St
- 15 Ware Dr
- 6 Elliot Mills Unit 31
Ask me questions while you tour the home.