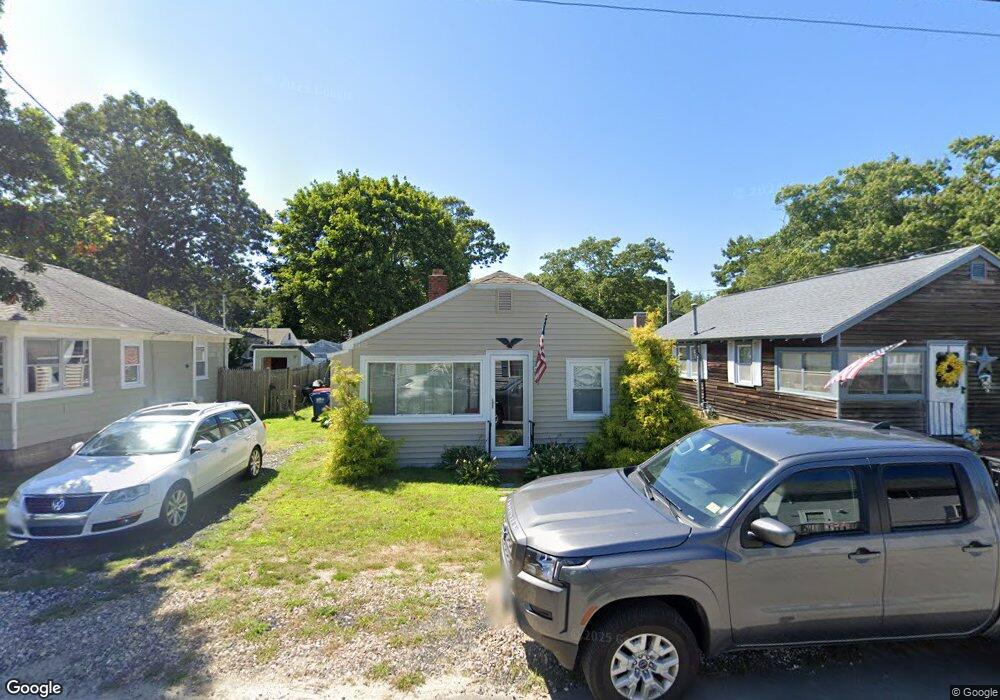
11 Bayview St Wareham, MA 02571
Wareham Center NeighborhoodEstimated Value: $123,000 - $344,000
About This Home
This home is located at 11 Bayview St, Wareham, MA 02571 and is currently estimated at $273,759, approximately $459 per square foot. 11 Bayview St is a home located in Plymouth County.
Ownership History
We collect this data history from publicly available records. To have your information removed, we recommend requesting removal directly through your county’s website.
Purchase Details
Home Financials for this Owner
Home Financials are based on the most recent Mortgage that was taken out on this home.Purchase Details
Purchase Details
Home Values in the Area
Average Home Value in this Area
Purchase History
We collect this data history from publicly available records. To have your information removed, we recommend requesting removal directly through your county’s website.
| Date | Buyer | Sale Price | Title Company |
|---|---|---|---|
| $100,000 | -- | ||
| -- | None Available | ||
| -- | None Available | ||
| -- | None Available | ||
| -- | -- | ||
| -- | -- |
Mortgage History
We collect this data history from publicly available records. To have your information removed, we recommend requesting removal directly through your county’s website.
| Date | Status | Borrower | Loan Amount |
|---|---|---|---|
| Open | $108,300 |
Tax History
We collect this data history from publicly available records. To have your information removed, we recommend requesting removal directly through your county’s website.
| Year | Tax Paid | Tax Assessment Tax Assessment Total Assessment is a certain percentage of the fair market value that is determined by local assessors to be the total taxable value of land and additions on the property. | Land | Improvement |
|---|---|---|---|---|
| 2025 | $2,812 | $269,900 | $106,600 | $163,300 |
| 2024 | $2,785 | $248,000 | $79,600 | $168,400 |
| 2023 | $2,451 | $220,800 | $72,400 | $148,400 |
| 2022 | $2,451 | $186,000 | $72,400 | $113,600 |
| 2021 | $2,291 | $170,300 | $72,400 | $97,900 |
| 2020 | $2,179 | $164,300 | $72,400 | $91,900 |
| 2019 | $1,975 | $148,600 | $64,700 | $83,900 |
| 2018 | $1,467 | $107,600 | $64,700 | $42,900 |
| 2017 | $1,389 | $103,300 | $64,700 | $38,600 |
| 2016 | $1,285 | $95,000 | $61,600 | $33,400 |
| 2015 | $1,242 | $95,000 | $61,600 | $33,400 |
| 2014 | $1,213 | $94,400 | $61,600 | $32,800 |
Map
- 17 Swift Ave
- 7 Swift Ave
- 6 Pine St
- 43 Shore Ave
- 1 Barnes St
- 11 Mya's Ct
- 9 Medina Dr
- 36 Wankinquoah Ave
- 192 Swifts Beach Rd
- 10 Surf Ave
- 8 Cottage St
- 4 Ross Ave
- 13 Woodland Cir
- 9 Rock Marsh Rd Unit B
- 9 Rock Marsh Rd Unit B
- 347 Marion Rd
- 22 Fairfield Dr
- 4 Wilson St
- 94 Edgewater Dr
- 27 Highland Shores Dr
Ask me questions while you tour the home.