11 Champy Ln Methuen, MA 01844
The East End NeighborhoodEstimated Value: $700,914
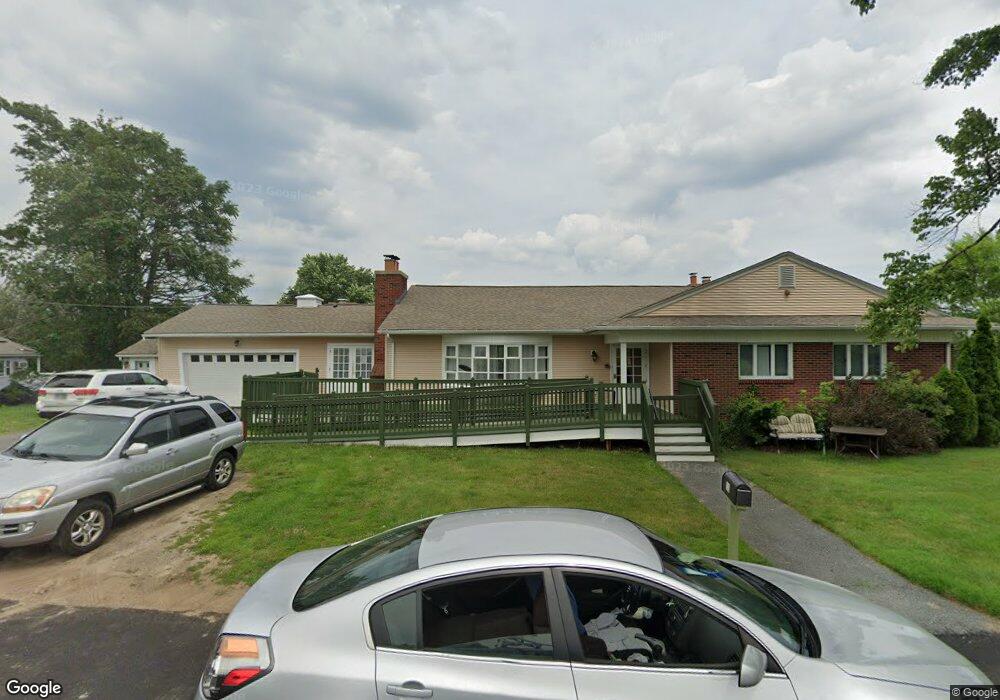
About This Home
This home is located at 11 Champy Ln, Methuen, MA 01844 and is currently estimated at $700,914, approximately $160 per square foot. 11 Champy Ln is a home located in Essex County with nearby schools including Timony Grammar School, Methuen High School, and Notre Dame Cristo Rey High School.
Ownership History
We collect this data history from publicly available records. To have your information removed, we recommend requesting removal directly through your county’s website.
Purchase Details
Home Financials for this Owner
Home Financials are based on the most recent Mortgage that was taken out on this home.Purchase Details
Home Financials for this Owner
Home Financials are based on the most recent Mortgage that was taken out on this home.Home Values in the Area
Average Home Value in this Area
Purchase History
We collect this data history from publicly available records. To have your information removed, we recommend requesting removal directly through your county’s website.
| Date | Buyer | Sale Price | Title Company |
|---|---|---|---|
| $299,900 | -- | ||
| $350,000 | -- | ||
| $350,000 | -- | ||
| $350,000 | -- |
Mortgage History
We collect this data history from publicly available records. To have your information removed, we recommend requesting removal directly through your county’s website.
| Date | Status | Borrower | Loan Amount |
|---|---|---|---|
| Open | $239,200 | ||
| Closed | $239,200 | ||
| Previous Owner | $537,500 |
Tax History
We collect this data history from publicly available records. To have your information removed, we recommend requesting removal directly through your county’s website.
| Year | Tax Paid | Tax Assessment Tax Assessment Total Assessment is a certain percentage of the fair market value that is determined by local assessors to be the total taxable value of land and additions on the property. | Land | Improvement |
|---|---|---|---|---|
| 2025 | -- | $717,700 | $240,000 | $477,700 |
| 2024 | -- | $695,800 | $218,100 | $477,700 |
| 2023 | $0 | $613,200 | $194,800 | $418,400 |
| 2022 | $0 | $527,200 | $155,800 | $371,400 |
| 2021 | $0 | $488,800 | $148,000 | $340,800 |
| 2020 | $0 | $477,100 | $148,000 | $329,100 |
| 2019 | $0 | $429,300 | $140,200 | $289,100 |
| 2018 | $0 | $415,600 | $140,200 | $275,400 |
| 2017 | $0 | $389,700 | $140,200 | $249,500 |
| 2016 | $4,380 | $378,000 | $140,200 | $237,800 |
| 2015 | $4,380 | $363,000 | $140,200 | $222,800 |
Map
- 5 Seneca St
- 2 Bailey St
- 19 Florence Rd
- 168 Jackson St
- 22 Lippold St
- 35 Harmony Ln
- 293 Jackson St
- 687 Jackson St
- 1 Alderbrook Ln
- 16 Quincy St
- 115 Pleasant St
- 6 Longview Terrace
- 35 Oakmeadow Ln
- 98 Pleasant View St
- 284 Oak St
- 261 Oak St
- 50 Danbury Dr Unit 19
- 1 Lady Slipper Ln
- 3 Lady Slipper Ln
- 10 Swan St
Ask me questions while you tour the home.