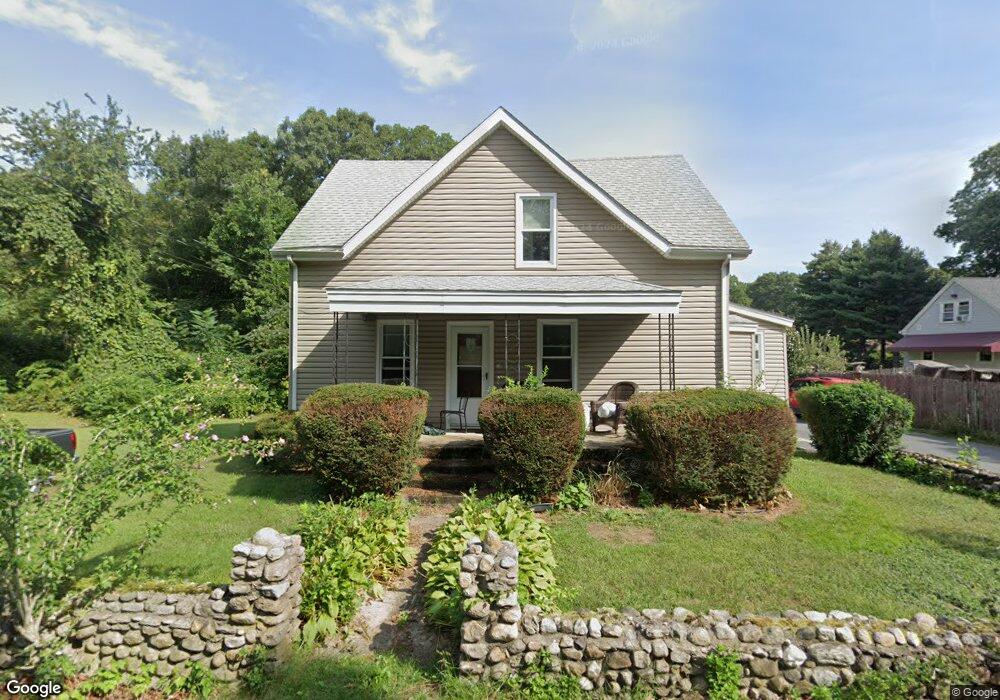
11 Chestnut St Bellingham, MA 02019
Estimated Value: $390,000 - $487,000
4
Beds
2
Baths
1,460
Sq Ft
$307/Sq Ft
Est. Value
About This Home
This home is located at 11 Chestnut St, Bellingham, MA 02019 and is currently estimated at $447,624, approximately $306 per square foot. 11 Chestnut St is a home located in Norfolk County with nearby schools including Joseph F. DiPietro Elementary, Bellingham High School, and Rise Prep Mayoral Academy Middle School.
Ownership History
Date
Name
Owned For
Owner Type
Purchase Details
Closed on
Jun 2, 2017
Sold by
Lariviere Roger H and Lariviere Susan W
Bought by
Lariviere Ft 2017
Current Estimated Value
Purchase Details
Closed on
Sep 14, 1993
Sold by
Roger H Est Lariviere and Lariviere Aroger H
Bought by
Lariviere Roger H and Lariviere Susan W
Purchase Details
Closed on
Sep 25, 1987
Sold by
Lariviere Jaennette
Bought by
Cordell Tr Thomas C
Home Financials for this Owner
Home Financials are based on the most recent Mortgage that was taken out on this home.
Original Mortgage
$780,000
Interest Rate
10.37%
Mortgage Type
Purchase Money Mortgage
Create a Home Valuation Report for This Property
The Home Valuation Report is an in-depth analysis detailing your home's value as well as a comparison with similar homes in the area
Home Values in the Area
Average Home Value in this Area
Purchase History
We collect this data history from publicly available records. To have your information removed, we recommend requesting removal directly through your county’s website.
| Date | Buyer | Sale Price | Title Company |
|---|---|---|---|
| Lariviere Ft 2017 | -- | -- | |
| Lariviere Roger H | $50,000 | -- | |
| Cordell Tr Thomas C | $225,000 | -- |
Source: Public Records
Mortgage History
We collect this data history from publicly available records. To have your information removed, we recommend requesting removal directly through your county’s website.
| Date | Status | Borrower | Loan Amount |
|---|---|---|---|
| Previous Owner | Cordell Tr Thomas C | $780,000 |
Source: Public Records
Tax History
| Year | Tax Paid | Tax Assessment Tax Assessment Total Assessment is a certain percentage of the fair market value that is determined by local assessors to be the total taxable value of land and additions on the property. | Land | Improvement |
|---|---|---|---|---|
| 2025 | $4,476 | $356,400 | $136,400 | $220,000 |
| 2024 | $4,250 | $330,500 | $124,500 | $206,000 |
| 2023 | $4,231 | $324,200 | $118,500 | $205,700 |
| 2022 | $4,102 | $291,300 | $98,900 | $192,400 |
| 2021 | $3,963 | $275,000 | $98,900 | $176,100 |
| 2020 | $3,548 | $249,500 | $94,000 | $155,500 |
| 2019 | $3,346 | $235,500 | $94,000 | $141,500 |
| 2018 | $3,298 | $228,900 | $94,900 | $134,000 |
| 2017 | $3,229 | $225,200 | $94,900 | $130,300 |
| 2016 | $3,314 | $231,900 | $98,600 | $133,300 |
| 2015 | $3,344 | $234,700 | $99,800 | $134,900 |
| 2014 | $3,350 | $228,500 | $96,300 | $132,200 |
Source: Public Records
Map
Nearby Homes
- 39 Whitehall Way
- 0 North St Unit 73440626
- 39 Elvira St
- 31 Lilac Ave
- 70 Oswego St
- 98 Elm St
- 3 Taylor Rd
- 273 Lake St
- 7 David Dr
- 20 Cooks Ln
- 61 Pine Grove Ave
- 6 David Dr
- 55 Elbow St
- 1 Whitman Cir Unit 1
- 3 Whitman Cir Unit 3
- 11 Whitman Cir Unit 11
- 0 Elm St Unit 73500651
- 21 Dorothy Ave
- Lot 4 Pickering Rd
- Lot 1 Pickering Rd
Your Personal Tour Guide
Ask me questions while you tour the home.