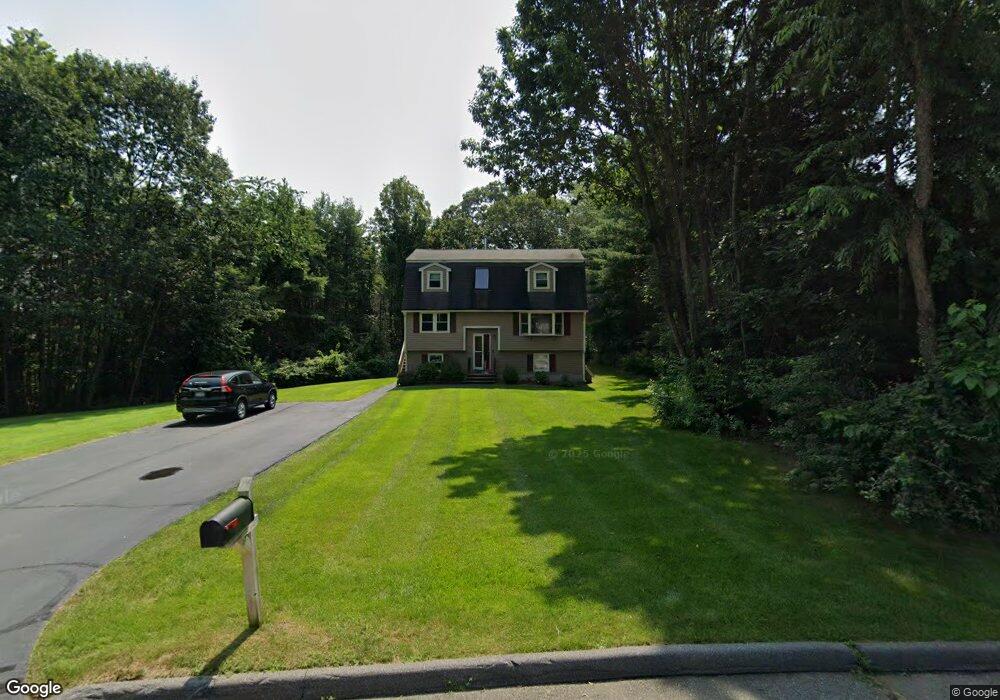
11 Cushing Dr Wilmington, MA 01887
Estimated Value: $796,650 - $888,000
3
Beds
2
Baths
1,694
Sq Ft
$491/Sq Ft
Est. Value
About This Home
This home is located at 11 Cushing Dr, Wilmington, MA 01887 and is currently estimated at $831,163, approximately $490 per square foot. 11 Cushing Dr is a home located in Middlesex County with nearby schools including Wilmington Middle School, Wilmington High School, and Abundant Life Christian School and Childcare.
Ownership History
Date
Name
Owned For
Owner Type
Purchase Details
Closed on
Mar 18, 2022
Sold by
11 Cushing Drive Rt
Bought by
Butler 2022 T
Current Estimated Value
Purchase Details
Closed on
Jan 22, 2009
Sold by
Butler John J and Butler Karen H
Bought by
11 Cushing Drive Rt
Purchase Details
Closed on
Apr 24, 1992
Sold by
Northeastern Dev Corp
Bought by
Mcdonough Karen H and Butler John J
Home Financials for this Owner
Home Financials are based on the most recent Mortgage that was taken out on this home.
Original Mortgage
$149,500
Interest Rate
8.78%
Create a Home Valuation Report for This Property
The Home Valuation Report is an in-depth analysis detailing your home's value as well as a comparison with similar homes in the area
Purchase History
| Date | Buyer | Sale Price | Title Company |
|---|---|---|---|
| Butler 2022 T | -- | None Available | |
| 11 Cushing Drive Rt | -- | -- | |
| Mcdonough Karen H | $186,900 | -- |
Source: Public Records
Mortgage History
| Date | Status | Borrower | Loan Amount |
|---|---|---|---|
| Previous Owner | Mcdonough Karen H | $146,400 | |
| Previous Owner | Mcdonough Karen H | $149,200 | |
| Previous Owner | Mcdonough Karen H | $149,500 |
Source: Public Records
Tax History
| Year | Tax Paid | Tax Assessment Tax Assessment Total Assessment is a certain percentage of the fair market value that is determined by local assessors to be the total taxable value of land and additions on the property. | Land | Improvement |
|---|---|---|---|---|
| 2025 | $7,913 | $691,100 | $320,300 | $370,800 |
| 2024 | $7,609 | $665,700 | $320,300 | $345,400 |
| 2023 | $7,338 | $614,600 | $291,200 | $323,400 |
| 2022 | $7,002 | $537,400 | $242,600 | $294,800 |
| 2021 | $6,959 | $502,800 | $220,500 | $282,300 |
| 2020 | $6,953 | $512,000 | $220,500 | $291,500 |
| 2019 | $6,469 | $470,500 | $210,100 | $260,400 |
| 2018 | $6,255 | $434,100 | $200,000 | $234,100 |
| 2017 | $6,445 | $446,000 | $200,000 | $246,000 |
| 2016 | $6,041 | $412,900 | $190,600 | $222,300 |
| 2015 | $5,617 | $390,900 | $190,600 | $200,300 |
| 2014 | $5,230 | $367,300 | $181,600 | $185,700 |
Source: Public Records
Map
Nearby Homes
Your Personal Tour Guide
Ask me questions while you tour the home.