11 Devon Ct Trenton, NJ 08691
Estimated Value: $378,000 - $422,000
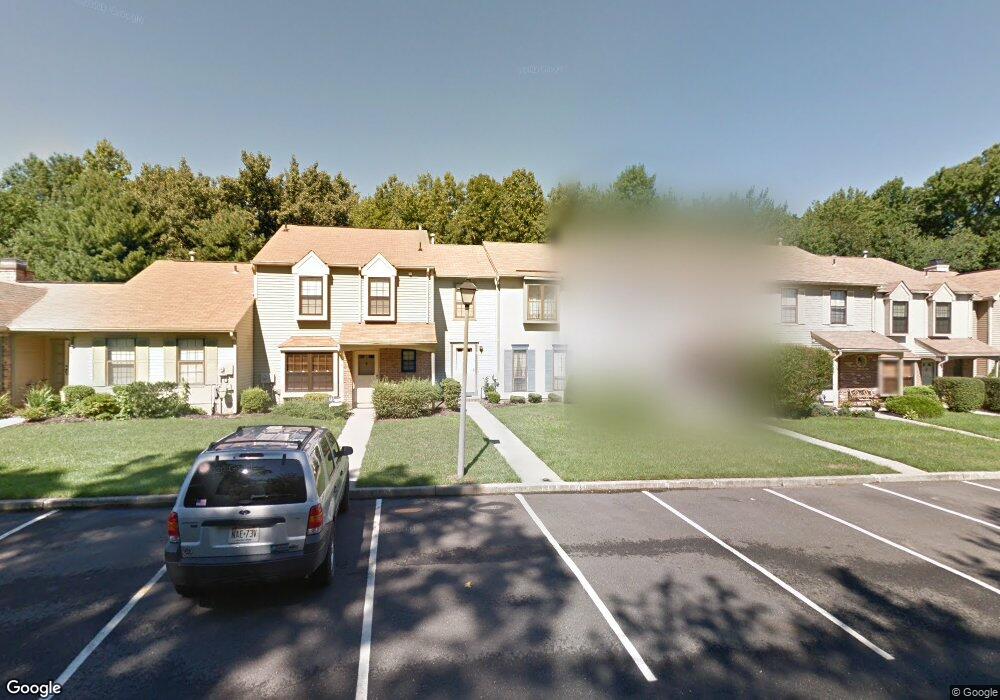
About This Home
This home is located at 11 Devon Ct, Trenton, NJ 08691 and is currently estimated at $402,041, approximately $337 per square foot. 11 Devon Ct is a home located in Mercer County with nearby schools including Sharon Elementary School, Pond Road Middle School, and Robbinsville High School.
Ownership History
We collect this data history from publicly available records. To have your information removed, we recommend requesting removal directly through your county’s website.
Purchase Details
Home Financials for this Owner
Home Financials are based on the most recent Mortgage that was taken out on this home.Purchase Details
Home Financials for this Owner
Home Financials are based on the most recent Mortgage that was taken out on this home.Home Values in the Area
Average Home Value in this Area
Purchase History
We collect this data history from publicly available records. To have your information removed, we recommend requesting removal directly through your county’s website.
| Date | Buyer | Sale Price | Title Company |
|---|---|---|---|
| $190,000 | Foundation Title Llc | ||
| $196,000 | None Available |
Mortgage History
We collect this data history from publicly available records. To have your information removed, we recommend requesting removal directly through your county’s website.
| Date | Status | Borrower | Loan Amount |
|---|---|---|---|
| Open | $161,500 | ||
| Previous Owner | $191,031 |
Tax History
We collect this data history from publicly available records. To have your information removed, we recommend requesting removal directly through your county’s website.
| Year | Tax Paid | Tax Assessment Tax Assessment Total Assessment is a certain percentage of the fair market value that is determined by local assessors to be the total taxable value of land and additions on the property. | Land | Improvement |
|---|---|---|---|---|
| 2025 | $6,550 | $196,000 | $144,000 | $52,000 |
| 2024 | $6,113 | $196,000 | $144,000 | $52,000 |
| 2023 | $6,113 | $196,000 | $144,000 | $52,000 |
| 2022 | $5,876 | $196,000 | $144,000 | $52,000 |
| 2021 | $5,792 | $196,000 | $144,000 | $52,000 |
| 2020 | $5,794 | $196,000 | $144,000 | $52,000 |
| 2019 | $5,796 | $196,000 | $144,000 | $52,000 |
| 2018 | $5,758 | $196,000 | $144,000 | $52,000 |
| 2017 | $5,747 | $196,000 | $144,000 | $52,000 |
| 2016 | $5,694 | $196,000 | $144,000 | $52,000 |
| 2015 | $5,608 | $196,000 | $144,000 | $52,000 |
| 2014 | $5,627 | $196,000 | $144,000 | $52,000 |
Map
- 10 Devon Ct
- 41 Emerald Rd
- 5 Kettering Ct
- 45 Emerald Rd
- 181 Wyndham Place
- 165 Wyndham Place
- 27 Tynemouth Ct
- 214 Wyndham Place
- 39 Banbury Ct
- 139 Wyndham Place
- 14 Wyndham Place
- 13 Ashford Ct
- 61 Wickom Ave
- 138 Wyndham Place
- 98 Wyndham Place
- 82 Beacon Place
- 35 Baltusrol St
- 23 Brown Dr
- 58 Beacon Place
- 51 Andover Place
Ask me questions while you tour the home.