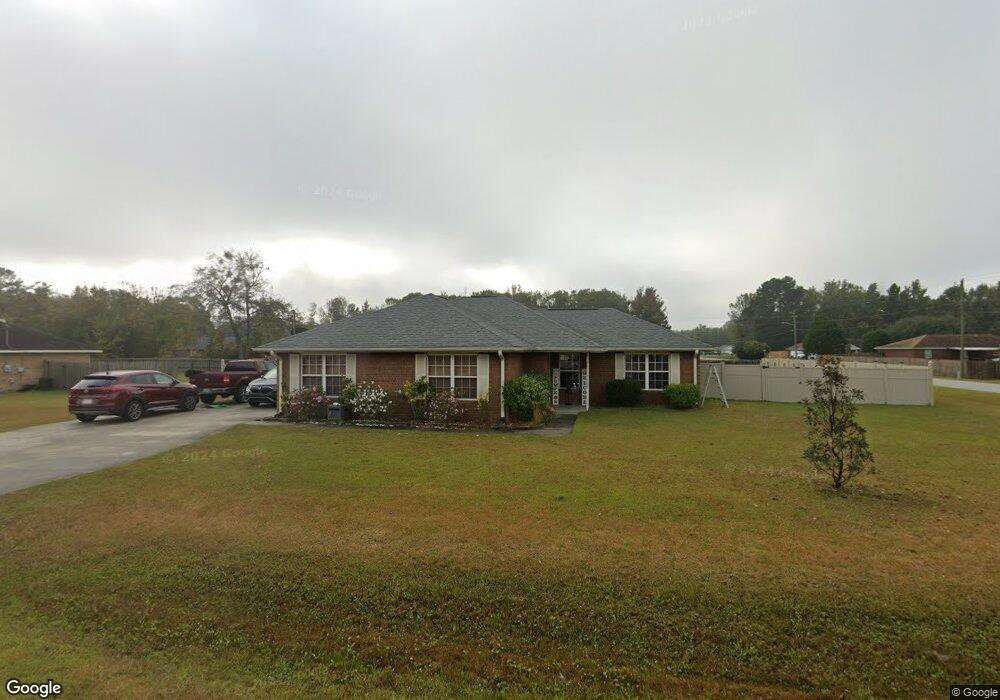
11 E Deer Ct Midway, GA 31320
Estimated Value: $258,000 - $268,000
4
Beds
2
Baths
1,779
Sq Ft
$149/Sq Ft
Est. Value
About This Home
This home is located at 11 E Deer Ct, Midway, GA 31320 and is currently estimated at $264,455, approximately $148 per square foot. 11 E Deer Ct is a home located in Liberty County with nearby schools including Liberty Elementary School, Midway Middle School, and Liberty County High School.
Ownership History
Date
Name
Owned For
Owner Type
Purchase Details
Closed on
Mar 28, 2006
Sold by
Simpson Lorraine Denise
Bought by
Fernandez Anthony H and Fernandez Annette
Current Estimated Value
Home Financials for this Owner
Home Financials are based on the most recent Mortgage that was taken out on this home.
Original Mortgage
$126,026
Outstanding Balance
$69,314
Interest Rate
6.2%
Mortgage Type
VA
Estimated Equity
$195,141
Purchase Details
Closed on
Mar 1, 2004
Sold by
R M Ray Developers Lcc
Bought by
Simpson Lorraine Denise
Purchase Details
Closed on
Oct 9, 2003
Sold by
Dykes & Hadwin Inc
Bought by
R M Ray Developers Llc
Create a Home Valuation Report for This Property
The Home Valuation Report is an in-depth analysis detailing your home's value as well as a comparison with similar homes in the area
Purchase History
| Date | Buyer | Sale Price | Title Company |
|---|---|---|---|
| Fernandez Anthony H | $122,000 | -- | |
| Simpson Lorraine Denise | $103,300 | -- | |
| R M Ray Developers Llc | -- | -- |
Source: Public Records
Mortgage History
| Date | Status | Borrower | Loan Amount |
|---|---|---|---|
| Open | Fernandez Anthony H | $126,026 |
Source: Public Records
Tax History
| Year | Tax Paid | Tax Assessment Tax Assessment Total Assessment is a certain percentage of the fair market value that is determined by local assessors to be the total taxable value of land and additions on the property. | Land | Improvement |
|---|---|---|---|---|
| 2025 | $3,236 | $87,209 | $20,000 | $67,209 |
| 2024 | $3,236 | $86,616 | $14,000 | $72,616 |
| 2023 | $3,101 | $76,688 | $12,000 | $64,688 |
| 2022 | $2,273 | $57,739 | $10,800 | $46,939 |
| 2021 | $2,063 | $52,497 | $10,800 | $41,697 |
| 2020 | $2,089 | $53,011 | $10,800 | $42,211 |
| 2019 | $1,867 | $48,517 | $10,000 | $38,517 |
| 2018 | $1,861 | $48,948 | $10,000 | $38,948 |
| 2017 | $1,994 | $46,999 | $8,000 | $38,999 |
| 2016 | $1,675 | $47,205 | $8,000 | $39,205 |
| 2015 | $2,002 | $47,205 | $8,000 | $39,205 |
| 2014 | $2,002 | $56,108 | $10,000 | $46,108 |
| 2013 | -- | $50,566 | $10,000 | $40,566 |
Source: Public Records
Map
Nearby Homes
- 146 River Bend Dr
- 12 E Red Fox Ct
- 48 W Beaver Ln
- 35 W Red Fox Ct
- 327 River Bend Dr
- 29 Arlen Dr
- 46 Delaney Ct
- 8701 E Oglethorpe Hwy
- 0 E Oglethorpe Unit SA341930
- 0 E Oglethorpe Unit 153327
- 0 E Oglethorpe Unit 10592168
- 0 E Oglethorpe Unit SA350017
- 0 E Oglethorpe Unit SA350025
- 260 Arlen Dr
- 0000 E Oglethorpe Hwy
- 182 Gloucester Dr
- 29 Sassafras Ln
- 0 S Coastal Hwy
- 135 Kettle Creek Ln
- 51 Lachlan Ln
Your Personal Tour Guide
Ask me questions while you tour the home.