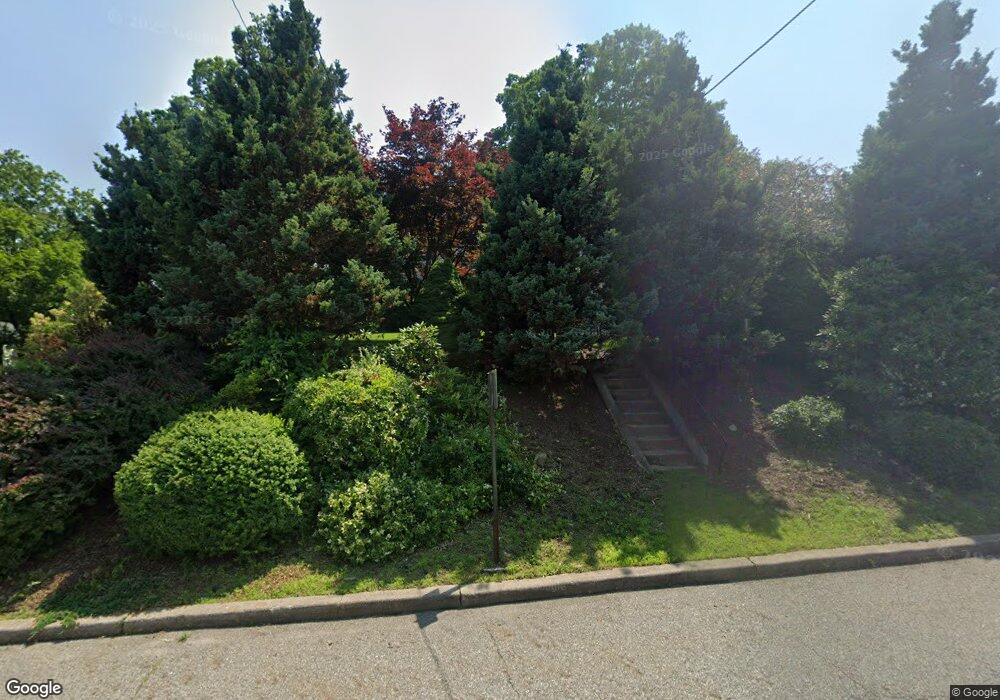
11 Elm St Butler, NJ 07405
Estimated Value: $515,082 - $578,000
Studio
--
Bath
1,736
Sq Ft
$310/Sq Ft
Est. Value
About This Home
This home is located at 11 Elm St, Butler, NJ 07405 and is currently estimated at $537,771, approximately $309 per square foot. 11 Elm St is a home located in Morris County with nearby schools including Aaron Decker School, Richard Butler School, and St Anthony Of Padua.
Ownership History
Date
Name
Owned For
Owner Type
Purchase Details
Closed on
Sep 16, 2005
Sold by
Hofbauer Paul
Bought by
Walek Incent and Walek Stacey
Current Estimated Value
Home Financials for this Owner
Home Financials are based on the most recent Mortgage that was taken out on this home.
Original Mortgage
$239,500
Outstanding Balance
$128,053
Interest Rate
5.84%
Mortgage Type
New Conventional
Estimated Equity
$409,718
Purchase Details
Closed on
Oct 30, 2002
Sold by
Hall Patricia
Bought by
Hofbauer Paul and Hofbauer Joanna
Home Financials for this Owner
Home Financials are based on the most recent Mortgage that was taken out on this home.
Original Mortgage
$264,100
Interest Rate
6.09%
Create a Home Valuation Report for This Property
The Home Valuation Report is an in-depth analysis detailing your home's value as well as a comparison with similar homes in the area
Home Values in the Area
Average Home Value in this Area
Purchase History
| Date | Buyer | Sale Price | Title Company |
|---|---|---|---|
| Walek Incent | $462,500 | -- | |
| Hofbauer Paul | $278,000 | -- |
Source: Public Records
Mortgage History
| Date | Status | Borrower | Loan Amount |
|---|---|---|---|
| Open | Walek Incent | $239,500 | |
| Previous Owner | Hofbauer Paul | $264,100 |
Source: Public Records
Tax History
| Year | Tax Paid | Tax Assessment Tax Assessment Total Assessment is a certain percentage of the fair market value that is determined by local assessors to be the total taxable value of land and additions on the property. | Land | Improvement |
|---|---|---|---|---|
| 2025 | $8,068 | $365,700 | $259,600 | $106,100 |
| 2024 | $7,880 | $323,100 | $224,600 | $98,500 |
Source: Public Records
Map
Nearby Homes
Your Personal Tour Guide
Ask me questions while you tour the home.