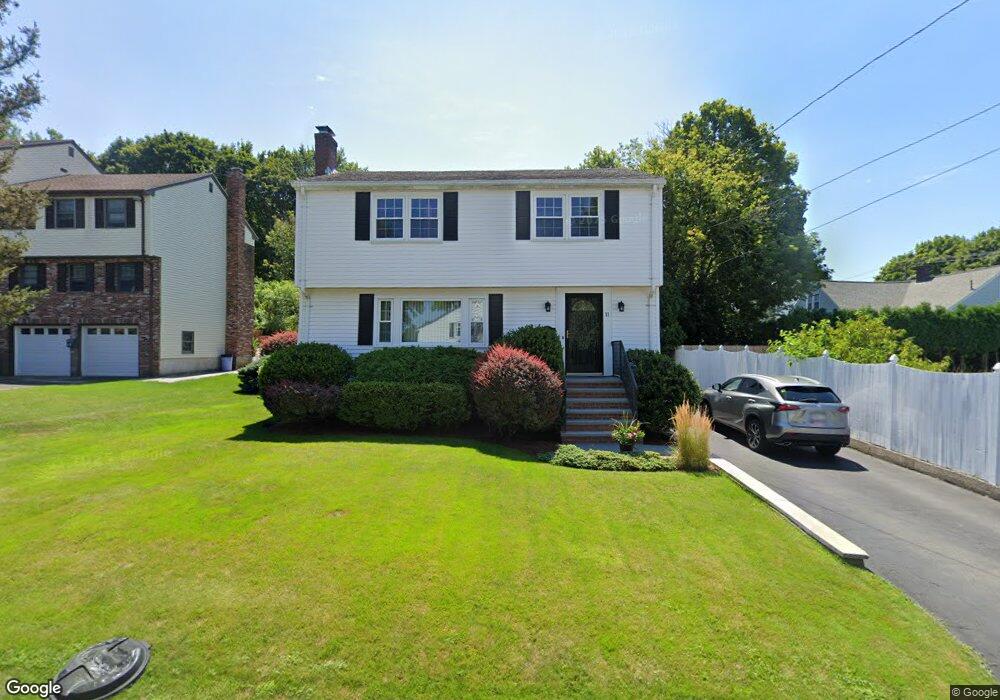
11 Fairview St Quincy, MA 02169
Quincy Center NeighborhoodEstimated Value: $755,000 - $781,078
3
Beds
2
Baths
1,758
Sq Ft
$437/Sq Ft
Est. Value
About This Home
This home is located at 11 Fairview St, Quincy, MA 02169 and is currently estimated at $768,520, approximately $437 per square foot. 11 Fairview St is a home located in Norfolk County with nearby schools including Charles A. Bernazzani Elementary School, Central Middle School, and Quincy High School.
Ownership History
Date
Name
Owned For
Owner Type
Purchase Details
Closed on
May 12, 2025
Sold by
Civitarese Ft and Rizzo
Bought by
Rizzo Suzanne N and Civitarese John D
Current Estimated Value
Purchase Details
Closed on
Jun 29, 2023
Sold by
Civitarese John D and Civitarese Clorinda
Bought by
Civitarese Ft and Rizzo
Purchase Details
Closed on
Oct 31, 1988
Sold by
Nobile Gerald V
Bought by
Civitarese John D
Home Financials for this Owner
Home Financials are based on the most recent Mortgage that was taken out on this home.
Original Mortgage
$70,000
Interest Rate
10.32%
Mortgage Type
Purchase Money Mortgage
Create a Home Valuation Report for This Property
The Home Valuation Report is an in-depth analysis detailing your home's value as well as a comparison with similar homes in the area
Home Values in the Area
Average Home Value in this Area
Purchase History
We collect this data history from publicly available records. To have your information removed, we recommend requesting removal directly through your county’s website.
| Date | Buyer | Sale Price | Title Company |
|---|---|---|---|
| Rizzo Suzanne N | -- | None Available | |
| Rizzo Suzanne N | -- | None Available | |
| Civitarese Ft | -- | None Available | |
| Civitarese Ft | -- | None Available | |
| Civitarese John D | $202,500 | -- |
Source: Public Records
Mortgage History
We collect this data history from publicly available records. To have your information removed, we recommend requesting removal directly through your county’s website.
| Date | Status | Borrower | Loan Amount |
|---|---|---|---|
| Previous Owner | Civitarese John D | $42,000 | |
| Previous Owner | Civitarese John D | $50,000 | |
| Previous Owner | Civitarese John D | $70,000 |
Source: Public Records
Tax History
| Year | Tax Paid | Tax Assessment Tax Assessment Total Assessment is a certain percentage of the fair market value that is determined by local assessors to be the total taxable value of land and additions on the property. | Land | Improvement |
|---|---|---|---|---|
| 2025 | $7,958 | $690,200 | $310,400 | $379,800 |
| 2024 | $7,528 | $668,000 | $295,800 | $372,200 |
| 2023 | $6,853 | $615,700 | $269,200 | $346,500 |
| 2022 | $6,799 | $567,500 | $245,000 | $322,500 |
| 2021 | $6,496 | $535,100 | $245,000 | $290,100 |
| 2020 | $6,263 | $503,900 | $233,400 | $270,500 |
| 2019 | $6,001 | $478,200 | $220,400 | $257,800 |
| 2018 | $6,303 | $472,500 | $220,400 | $252,100 |
| 2017 | $6,216 | $438,700 | $210,100 | $228,600 |
| 2016 | $5,939 | $413,600 | $200,200 | $213,400 |
| 2015 | $5,782 | $396,000 | $200,200 | $195,800 |
| 2014 | $5,506 | $370,500 | $190,800 | $179,700 |
Source: Public Records
Map
Nearby Homes
- 308 Quarry St Unit 405
- 18 Jenness St
- 166 Suomi Rd
- 211 Copeland St
- 230 Willard St Unit 602
- 580 Quarry St Unit 18
- 33 Bishop Rd Unit 33
- 30 Hillside Ave
- 165 Whitwell St
- 200 Adams St
- 14 Fallon Ct Unit 14
- 31 Station St
- 91 Garfield St
- 169 Pine St
- 156 West St
- 141 Gardiner Rd
- 94 Grafton Ave
- 154 Glendale Rd Unit 2
- 43 Dixwell Ave
- 440 Granite Ave Unit 201
Your Personal Tour Guide
Ask me questions while you tour the home.