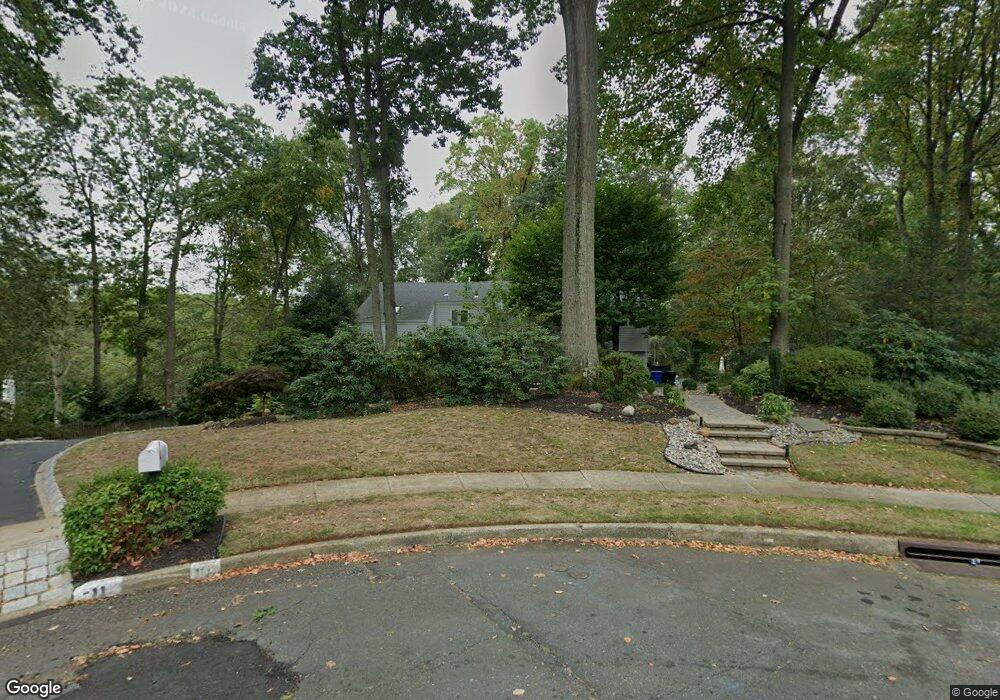
11 Ferrin Ct Middletown, NJ 07748
New Monmouth NeighborhoodEstimated Value: $1,175,000 - $1,232,000
About This Home
This home is located at 11 Ferrin Ct, Middletown, NJ 07748 and is currently estimated at $1,208,316, approximately $424 per square foot. 11 Ferrin Ct is a home located in Monmouth County with nearby schools including Nut Swamp Elementary School, Thompson Middle School, and Middletown - South High School.
Ownership History
We collect this data history from publicly available records. To have your information removed, we recommend requesting removal directly through your county’s website.
Purchase Details
Home Financials for this Owner
Home Financials are based on the most recent Mortgage that was taken out on this home.Home Values in the Area
Average Home Value in this Area
Purchase History
We collect this data history from publicly available records. To have your information removed, we recommend requesting removal directly through your county’s website.
| Date | Buyer | Sale Price | Title Company |
|---|---|---|---|
| $363,000 | -- |
Mortgage History
We collect this data history from publicly available records. To have your information removed, we recommend requesting removal directly through your county’s website.
| Date | Status | Borrower | Loan Amount |
|---|---|---|---|
| Open | $290,400 |
Tax History
We collect this data history from publicly available records. To have your information removed, we recommend requesting removal directly through your county’s website.
| Year | Tax Paid | Tax Assessment Tax Assessment Total Assessment is a certain percentage of the fair market value that is determined by local assessors to be the total taxable value of land and additions on the property. | Land | Improvement |
|---|---|---|---|---|
| 2025 | $15,825 | $1,023,900 | $474,300 | $549,600 |
| 2024 | $15,353 | $962,000 | $422,500 | $539,500 |
| 2023 | $15,353 | $883,400 | $343,900 | $539,500 |
| 2022 | $13,433 | $735,800 | $315,400 | $420,400 |
| 2021 | $13,433 | $645,800 | $282,200 | $363,600 |
| 2020 | $13,587 | $635,500 | $282,200 | $353,300 |
| 2019 | $13,367 | $632,900 | $282,200 | $350,700 |
| 2018 | $13,273 | $612,500 | $282,200 | $330,300 |
| 2017 | $12,976 | $610,900 | $282,200 | $328,700 |
| 2016 | $12,066 | $566,200 | $286,900 | $279,300 |
| 2015 | $11,643 | $545,100 | $267,900 | $277,200 |
| 2014 | $11,663 | $532,800 | $258,400 | $274,400 |
Map
- 54 Howland Rd
- 198 Borden Rd
- 100 Borden Rd
- 25 Dellwood Ct
- 1 Cook Place
- 198 Deepdale Dr
- 53 Heron Rd
- 177 Kingfisher Dr
- 17 Ballantine Rd
- 121 Townsend Dr
- 25 Pelican Rd
- 25 Crane Ct
- 18 Lefferts Ct
- 2 Borden Rd
- 33 Fish Hawk Dr
- 245 Kingfisher Dr
- 31 Vaughn Dr
- 27 Fox Hill Rd
- 911 Middletown Lincroft Rd
- 72 Marcshire Dr
Ask me questions while you tour the home.